ロング
WAVES-BTC Trade Idea
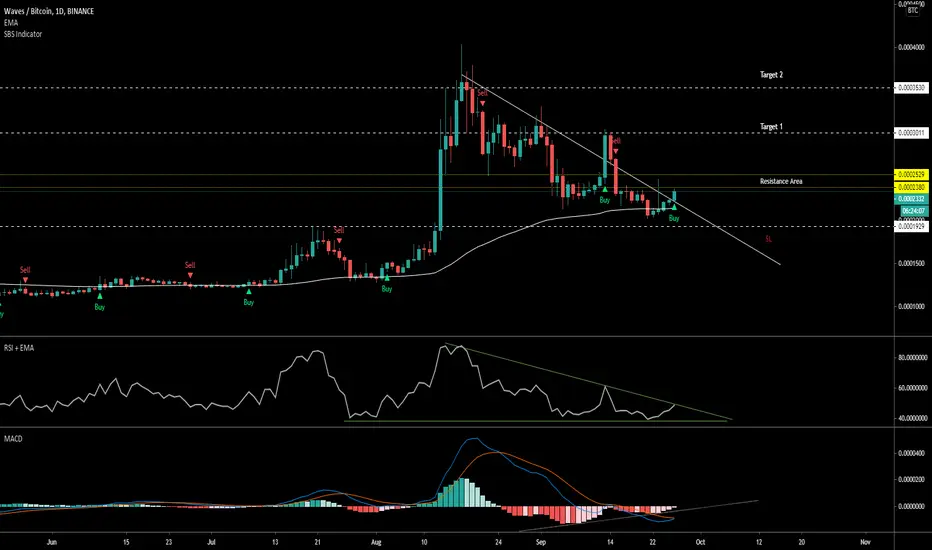
WAVES is breaking out of the trend Line on Daily TF
There is small resistance (Yellow Line) at the Breakout. Break out with good volume will reach Target 1
EMA 89 is acting as a support.
RSI is rising and breakout of the trendline which is acting a diagonal resistance.
MACD is about to cross bullish on Daily chart
MACD histogram is showing Bullish Divergence
SBS Indicator is signaling BUY on Daily chart
Target and SL are on the chart.
Lets see how this plays out.
トレード終了: 利益確定目標に到達
All targets reached
Tip Jar
PayPal - paypal.me/vickyprudhvi
PayPal - paypal.me/vickyprudhvi
関連の投稿
免責事項
これらの情報および投稿は、TradingViewが提供または承認する金融、投資、取引、またはその他の種類の助言もしくは推奨であることを意図したものではなく、またこれらに該当するものでもありません。詳細は利用規約をご覧ください。
Tip Jar
PayPal - paypal.me/vickyprudhvi
PayPal - paypal.me/vickyprudhvi
関連の投稿
免責事項
これらの情報および投稿は、TradingViewが提供または承認する金融、投資、取引、またはその他の種類の助言もしくは推奨であることを意図したものではなく、またこれらに該当するものでもありません。詳細は利用規約をご覧ください。