ロング
$WISH WHATS NEXT? TENDIES!! 🍗 🚀 🌕
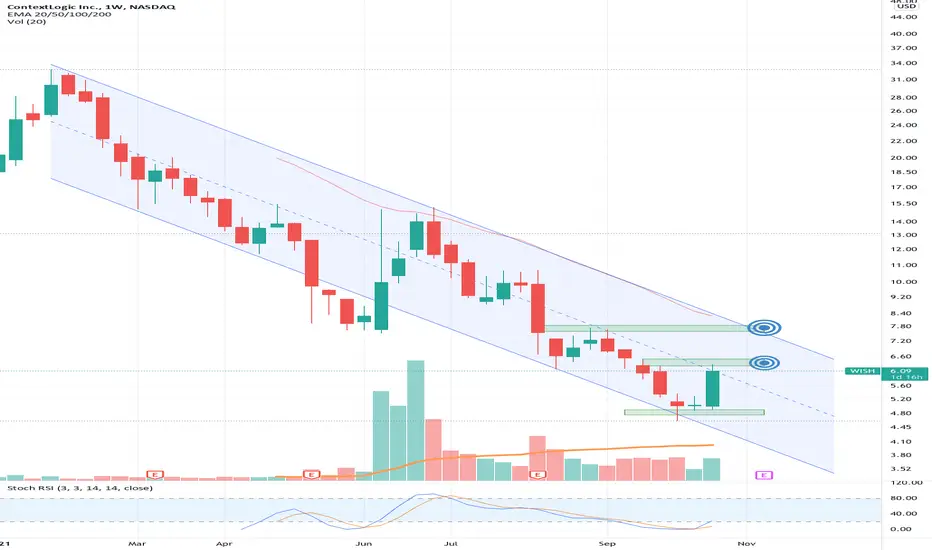
* Weekly chart it’s been trading inside this parallel channel since IPO on December 16, 2020.
* If price action is consistent we might see a rebound to the 100EMA on the daily chart.
* 15 minutes chart is sitting at the 20EMA since the start of this trend.
* 36.88% UP since bottom on Oct 16.
* Price Target
- [x] 6.30
- [ ] 7.70ish
トレード終了: 利益確定目標に到達

免責事項
これらの情報および投稿は、TradingViewが提供または承認する金融、投資、取引、またはその他の種類の助言もしくは推奨であることを意図したものではなく、またこれらに該当するものでもありません。詳細は利用規約をご覧ください。
免責事項
これらの情報および投稿は、TradingViewが提供または承認する金融、投資、取引、またはその他の種類の助言もしくは推奨であることを意図したものではなく、またこれらに該当するものでもありません。詳細は利用規約をご覧ください。