ロング
Walmart by the Hour
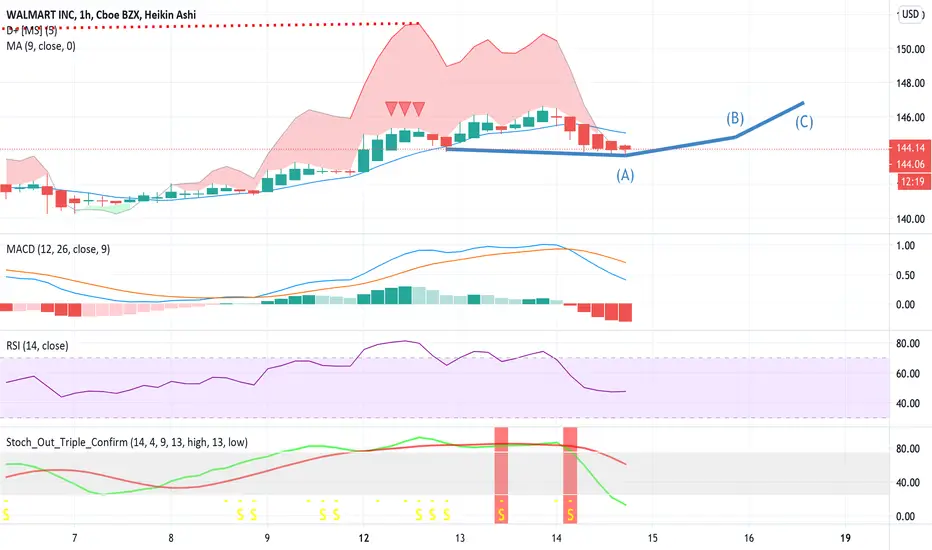
With the small candle at point A we can see that the bearish selling has been getting weaker. The MACD shows strong bear strength but could quickly weaken. As they are loosing buying strength. How do I know they are loosing strength? Take a look at the RSI. WMT returned to its normal range of 48 for its RSI and does not historically stay that low very long. Follow to see how my trend line turns out, give a like if you are a Walmart Bull, and finally comment your thoughts if you agree or disagree. Would love to hear your thoughts. Thank you!
ノート
Just checking back in on some of my Charts and from point (A) to point (B) I nailed it! Lets see point (B) to (C)
関連の投稿
免責事項
これらの情報および投稿は、TradingViewが提供または承認する金融、投資、取引、またはその他の種類の助言もしくは推奨であることを意図したものではなく、またこれらに該当するものでもありません。詳細は利用規約をご覧ください。
免責事項
これらの情報および投稿は、TradingViewが提供または承認する金融、投資、取引、またはその他の種類の助言もしくは推奨であることを意図したものではなく、またこれらに該当するものでもありません。詳細は利用規約をご覧ください。