
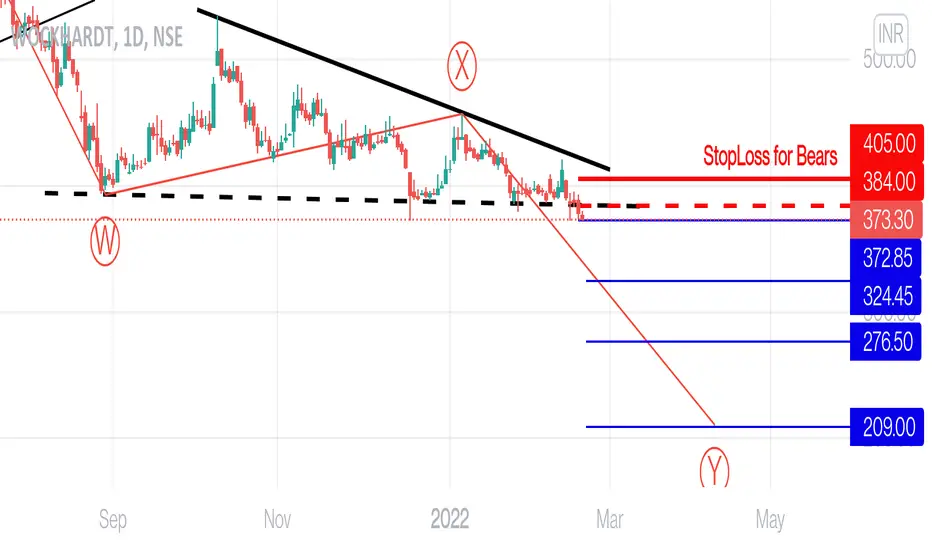
Wockhardt broke the triangle on the downside on weekly chart closing below 384, which can show down levels of 372, 324, 276, & upto 209. Wave Structure is also suggesting Corrective phase, along with trend indicators alignment in same direction, Now the triangle may be an X wave unless we go above 384 and hold, also I'll mention that on the way upside, there is major resistance or hurdle at 405, closing above these areas will invalidate all bearish bias.
Overall wave structure could be like this

Key Levels are Mentioned on chart

Macd in daily Negative crossover and down tick below zero line

Macd in weekly Negative crossover and down tick below zero line

Macd in Monthly Negative crossover and down tick below zero line

Rsi in daily down tick and below 40 level

Rsi in Weekly down tick and below 40 levels

Lower bollinger band challenged in daily

Dmi adx also giving Negative power

Disclaimer
I am not sebi registered analyst.
My studies are Educational purpose only.
Please consult your Financial advisor before trading or investing.
Overall wave structure could be like this
Key Levels are Mentioned on chart
Macd in daily Negative crossover and down tick below zero line
Macd in weekly Negative crossover and down tick below zero line
Macd in Monthly Negative crossover and down tick below zero line
Rsi in daily down tick and below 40 level
Rsi in Weekly down tick and below 40 levels
Lower bollinger band challenged in daily
Dmi adx also giving Negative power
Disclaimer
I am not sebi registered analyst.
My studies are Educational purpose only.
Please consult your Financial advisor before trading or investing.

YouTube: youtube.com/@rk_charts
Telegram : t.me/RK_Charts
Twitter : @charts_rk
Email : rkcharts@gmail. com
Disclaimer.
I am not sebi registered analyst.
My studies are for educational purpose only.
Telegram : t.me/RK_Charts
Twitter : @charts_rk
Email : rkcharts@gmail. com
Disclaimer.
I am not sebi registered analyst.
My studies are for educational purpose only.
関連の投稿
免責事項
これらの情報および投稿は、TradingViewが提供または承認する金融、投資、取引、またはその他の種類の助言もしくは推奨であることを意図したものではなく、またこれらに該当するものでもありません。詳細は利用規約をご覧ください。