ロング
Flying trade.
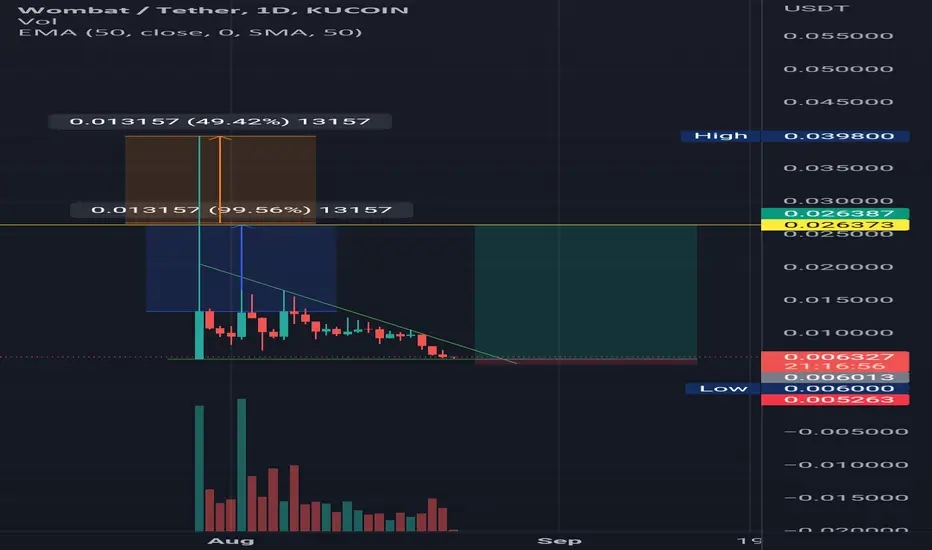
From this analysis, we could see the support level rejecting the current candle from breaking down. A trend line across the price previous wick which makes it form a triangle of a end point to the lower corner. A break out to test 50% on the previous highest high candle stick wick in day one of the listing (on Kucoin, where I got the chart history from).

免責事項
これらの情報および投稿は、TradingViewが提供または承認する金融、投資、取引、またはその他の種類の助言もしくは推奨であることを意図したものではなく、またこれらに該当するものでもありません。詳細は利用規約をご覧ください。
免責事項
これらの情報および投稿は、TradingViewが提供または承認する金融、投資、取引、またはその他の種類の助言もしくは推奨であることを意図したものではなく、またこれらに該当するものでもありません。詳細は利用規約をご覧ください。