ロング
WRX/BTC
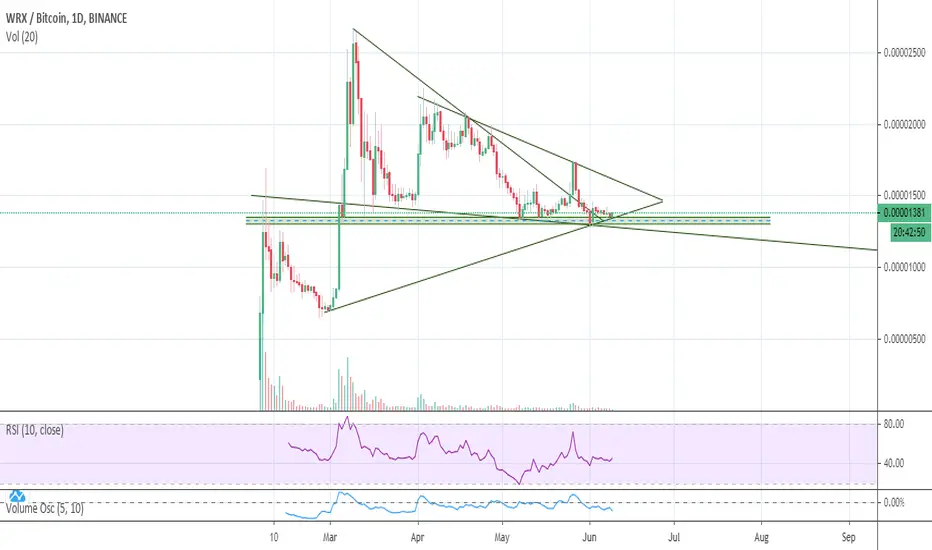
Not an expert. I'm simple, but simple works for me. Buy zone is highlighted just needs some volume to come in. RSI is showing a bullish divergence on the daily.
Break and close below 1270-ish and it's more downside. Break the diagonal trend line and it's more upside!
Break and close below 1270-ish and it's more downside. Break the diagonal trend line and it's more upside!
ノート
The diagonal support line that I have drawn is broken, but the horizontal support line is still holding. I'm not sure how this will play out, but I'd certainly be cautious here. If the horizontal line breaks, then there's a lot of space down below. A drop of 50% is certainly not out of the question.Diagonal trend lines are a bit tricky since you can always redraw them to fit your bias.
手動でトレードを終了しました
See below for updated chart.
免責事項
これらの情報および投稿は、TradingViewが提供または承認する金融、投資、取引、またはその他の種類の助言もしくは推奨であることを意図したものではなく、またこれらに該当するものでもありません。詳細は利用規約をご覧ください。
免責事項
これらの情報および投稿は、TradingViewが提供または承認する金融、投資、取引、またはその他の種類の助言もしくは推奨であることを意図したものではなく、またこれらに該当するものでもありません。詳細は利用規約をご覧ください。