
Renewed geopolitical tensions are pushing oil prices higher.
🛎WTI Update:
1. Market Overview
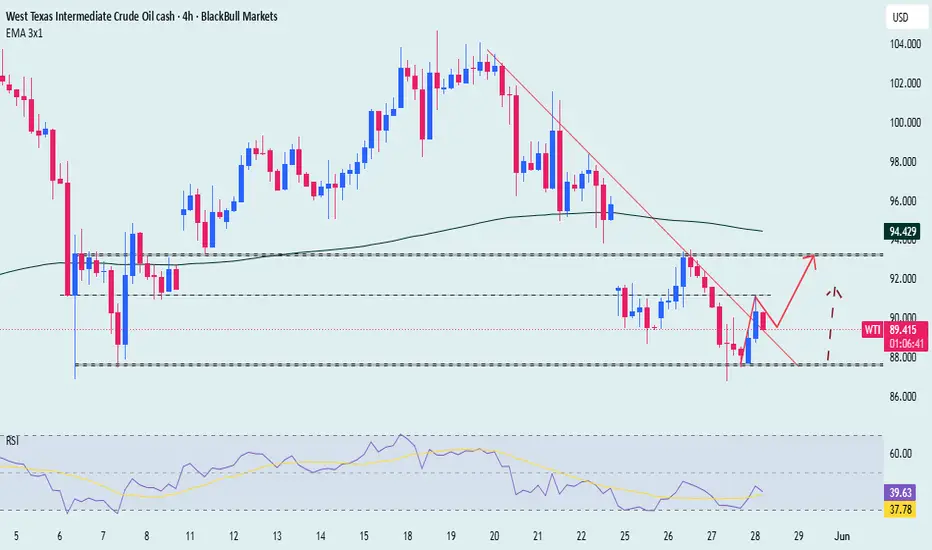
West Texas Intermediate (WTI) crude oil, the US benchmark, is experiencing a mild pullback during the early European session on Thursday around the 89.50 area.
However, WTI still maintains bullish momentum today as geopolitical tensions between the United States and Iran continue to escalate. Market sentiment remains supported after the US Treasury imposed sanctions related to the Strait of Hormuz, while Iran’s Islamic Revolutionary Guard Corps (IRGC) was reportedly targeting a US air base in response to recent strikes near Bandar Abbas airport.
2. Technical Analysis
WTI recently failed to break above the 97.50 resistance zone, causing buyers to push price back toward the 91 area before the current corrective decline around 89.60.
On the H4 timeframe, price has confirmed a trendline breakout and retest, suggesting that the short-term bullish trend may continue to remain active.
In addition, the RSI is showing a mild bullish convergence against price action, indicating that a potential bullish reversal could develop in the short term.
🔑 Key Levels
Resistance Zones
* 91.00
* 93.00
Support Zone / Demand Zone
* 87.50
Wishing you a successful trading day
1. Market Overview
West Texas Intermediate (WTI) crude oil, the US benchmark, is experiencing a mild pullback during the early European session on Thursday around the 89.50 area.
However, WTI still maintains bullish momentum today as geopolitical tensions between the United States and Iran continue to escalate. Market sentiment remains supported after the US Treasury imposed sanctions related to the Strait of Hormuz, while Iran’s Islamic Revolutionary Guard Corps (IRGC) was reportedly targeting a US air base in response to recent strikes near Bandar Abbas airport.
2. Technical Analysis
WTI recently failed to break above the 97.50 resistance zone, causing buyers to push price back toward the 91 area before the current corrective decline around 89.60.
On the H4 timeframe, price has confirmed a trendline breakout and retest, suggesting that the short-term bullish trend may continue to remain active.
In addition, the RSI is showing a mild bullish convergence against price action, indicating that a potential bullish reversal could develop in the short term.
🔑 Key Levels
Resistance Zones
* 91.00
* 93.00
Support Zone / Demand Zone
* 87.50
Wishing you a successful trading day
トレード稼働中
the plan is still on track トレード終了: 利益確定目標に到達
Complete the original plan 
関連の投稿
免責事項
これらの情報および投稿は、TradingViewが提供または承認する金融、投資、取引、またはその他の種類の助言もしくは推奨であることを意図したものではなく、またこれらに該当するものでもありません。詳細は利用規約をご覧ください。
関連の投稿
免責事項
これらの情報および投稿は、TradingViewが提供または承認する金融、投資、取引、またはその他の種類の助言もしくは推奨であることを意図したものではなく、またこれらに該当するものでもありません。詳細は利用規約をご覧ください。