
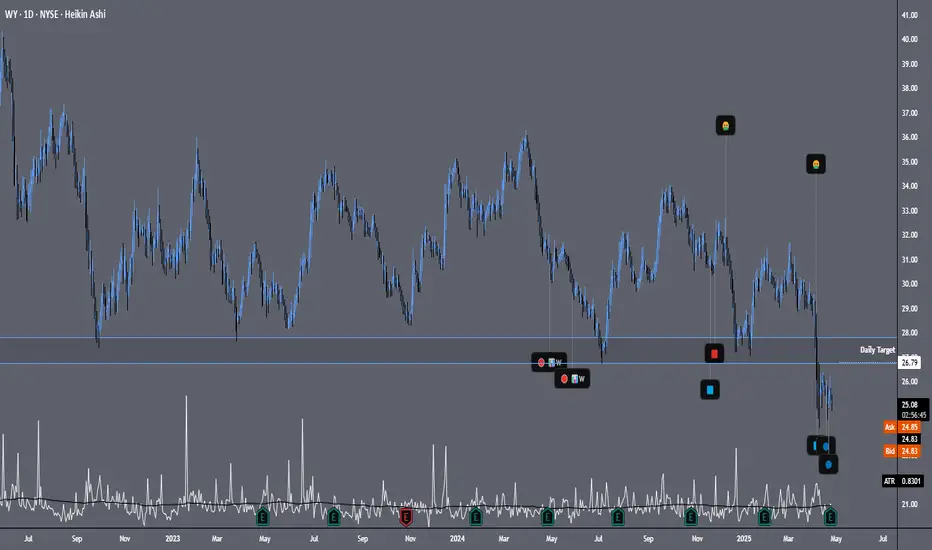
The current price is near a type of support base being created possibly. Earnings just happened recently and seems like there were mixed results. Won't get too much into that. However, if you look at the "throw up" emojis, price dropped sharply and price started trading sideways before bulls came back into the market. Let's see if we can get some momentum into this potential move eventually. Bearish volume has dropped since that sharp drop and with price trading sideways while also creating a base of support of some sort, I would like to see price reach the target zone located on the chart. Since September of 2022, price has infiltrated this zone about 4-5 times. Could we get a repeat of recent history?

免責事項
これらの情報および投稿は、TradingViewが提供または承認する金融、投資、取引、またはその他の種類の助言もしくは推奨であることを意図したものではなく、またこれらに該当するものでもありません。詳細は利用規約をご覧ください。
免責事項
これらの情報および投稿は、TradingViewが提供または承認する金融、投資、取引、またはその他の種類の助言もしくは推奨であることを意図したものではなく、またこれらに該当するものでもありません。詳細は利用規約をご覧ください。