
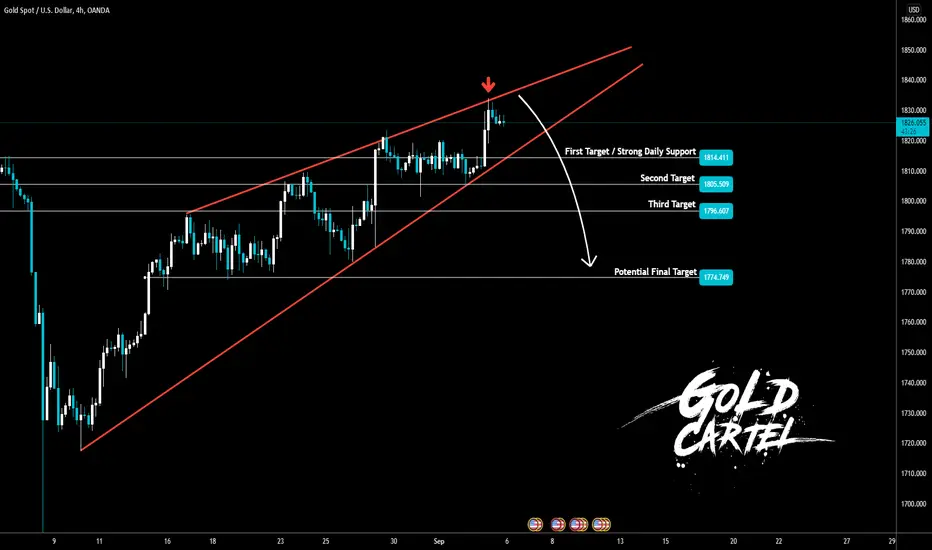
Currently, the price action showing a potential rising wedge on the H4 time-frame.
Plan:
- If the price rejects and stays below the upper rising wedge line, I reckon XAU will fall to the bottom rising wedge line. If the price can break and close below the bottom rising wedge line, XAU will definitely fall to all the targets this month.
Invalidation:
- This analysis fails if the price breakout and close above the upper rising wedge line
A rising wedge is a technical indicator, suggesting a reversal pattern frequently seen in bear markets. This pattern shows up in charts when the price moves upward, with pivot highs and lows converging toward a single point known as the apex. -*Investopedia
Plan:
- If the price rejects and stays below the upper rising wedge line, I reckon XAU will fall to the bottom rising wedge line. If the price can break and close below the bottom rising wedge line, XAU will definitely fall to all the targets this month.
Invalidation:
- This analysis fails if the price breakout and close above the upper rising wedge line
A rising wedge is a technical indicator, suggesting a reversal pattern frequently seen in bear markets. This pattern shows up in charts when the price moves upward, with pivot highs and lows converging toward a single point known as the apex. -*Investopedia

免責事項
これらの情報および投稿は、TradingViewが提供または承認する金融、投資、取引、またはその他の種類の助言もしくは推奨であることを意図したものではなく、またこれらに該当するものでもありません。詳細は利用規約をご覧ください。
免責事項
これらの情報および投稿は、TradingViewが提供または承認する金融、投資、取引、またはその他の種類の助言もしくは推奨であることを意図したものではなく、またこれらに該当するものでもありません。詳細は利用規約をご覧ください。