
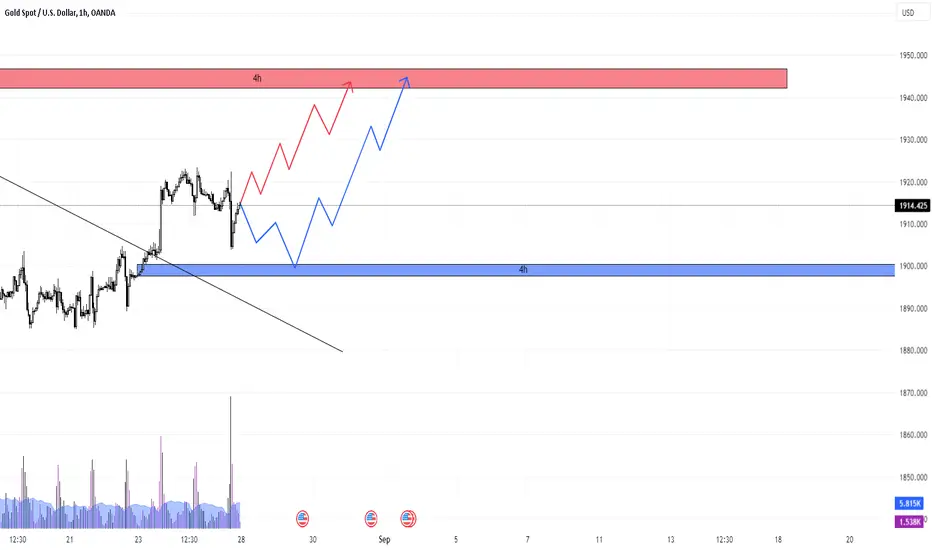
As I mentioned in the previous analysis, with the breaking of the trend line B, gold can see higher prices.
Although the price chart is bearish in the weekly and daily time frames, my short-term analysis will be as follows:
Support: 1897-5/1900
Resistance: 1942-1947
Although the price chart is bearish in the weekly and daily time frames, my short-term analysis will be as follows:
Support: 1897-5/1900
Resistance: 1942-1947

免責事項
これらの情報および投稿は、TradingViewが提供または承認する金融、投資、取引、またはその他の種類の助言もしくは推奨であることを意図したものではなく、またこれらに該当するものでもありません。詳細は利用規約をご覧ください。
免責事項
これらの情報および投稿は、TradingViewが提供または承認する金融、投資、取引、またはその他の種類の助言もしくは推奨であることを意図したものではなく、またこれらに該当するものでもありません。詳細は利用規約をご覧ください。