
📈 Bullish Fibonacci Retracement Setup
Intro
⸻⸻⸻⸻⸻⸻⸻⸻⸻⸻⸻⸻⸻
🟩 Chart Overview
⸻⸻⸻⸻⸻⸻⸻⸻⸻⸻⸻⸻⸻
📊 Key Fibonacci Levels
⸻⸻⸻⸻⸻⸻⸻⸻⸻⸻⸻⸻⸻
🎯 Trail Levels
⸻⸻⸻⸻⸻⸻⸻⸻⸻⸻⸻⸻⸻
✅ Summary
• Price is retracing within a strong bullish trend.
• A close above the 78.6% Validation Line confirms continuation.
• Structure remains valid as long as price holds above the 38.2% Devalidation Line.
• Trail progressively with momentum as higher targets activate.
⸻⸻⸻⸻⸻⸻⸻⸻⸻⸻⸻⸻⸻
⚠️ Disclaimer:
📘 For educational purposes only.
🙅 Not SEBI registered.
❌ Not a buy/sell recommendation.
🧠 Purely a learning resource.
📊 Not Financial Advice.
Intro
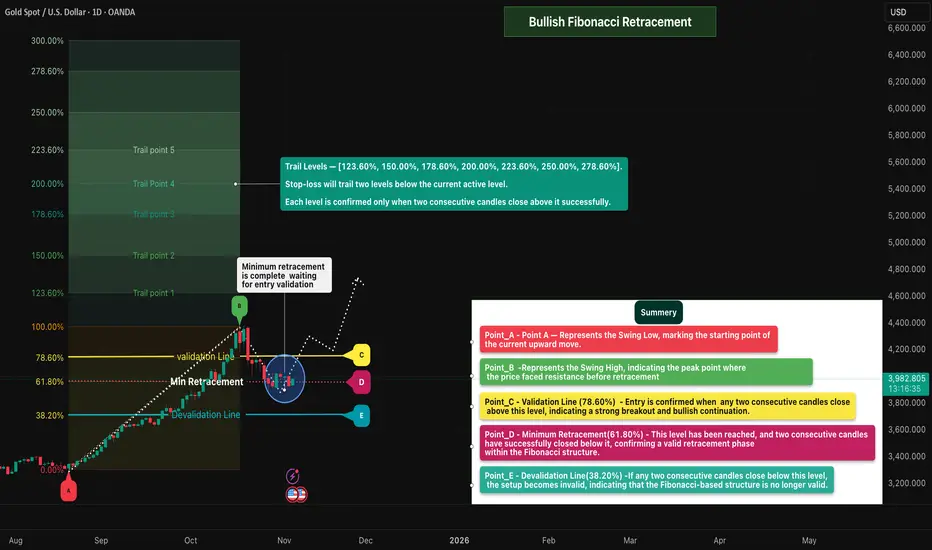
The chart illustrates a classic Bullish Fibonacci Retracement structure — highlighting key swing points, retracement levels, and potential continuation zones.
Price action shows a healthy pullback within a larger uptrend, suggesting accumulation before a possible breakout move.
⸻⸻⸻⸻⸻⸻⸻⸻⸻⸻⸻⸻⸻
🟩 Chart Overview
• Point A → Represents the Swing Low, marking the starting point of the current upward move.
• Point B → Denotes the Swing High, where price faced resistance before retracing.
⸻⸻⸻⸻⸻⸻⸻⸻⸻⸻⸻⸻⸻
📊 Key Fibonacci Levels
1️⃣ Validation Line (78.60%) — Entry is confirmed when any two consecutive candles close above this level, signaling a strong breakout and bullish continuation.
2️⃣ Minimum Retracement (61.80%) — This level has been achieved, and two candles have successfully closed below it, confirming a valid retracement phase within the Fibonacci structure.
3️⃣ Devalidation Line (38.20%) — If any two candles close below this level, the Fibonacci setup becomes invalid.
⸻⸻⸻⸻⸻⸻⸻⸻⸻⸻⸻⸻⸻
🎯 Trail Levels
Trail Levels → [123.60%, 150.00%, 178.60%, 200.00%, 223.60%, 250.00%, 278.60%]
• Stop-loss will trail two levels below the current active level.
• Each target level is confirmed only when two consecutive candles close above it successfully.
⸻⸻⸻⸻⸻⸻⸻⸻⸻⸻⸻⸻⸻
✅ Summary
• Price is retracing within a strong bullish trend.
• A close above the 78.6% Validation Line confirms continuation.
• Structure remains valid as long as price holds above the 38.2% Devalidation Line.
• Trail progressively with momentum as higher targets activate.
⸻⸻⸻⸻⸻⸻⸻⸻⸻⸻⸻⸻⸻
⚠️ Disclaimer:
📘 For educational purposes only.
🙅 Not SEBI registered.
❌ Not a buy/sell recommendation.
🧠 Purely a learning resource.
📊 Not Financial Advice.

Pine Script Developer • Market Analysis
関連の投稿
免責事項
これらの情報および投稿は、TradingViewが提供または承認する金融、投資、取引、またはその他の種類の助言もしくは推奨であることを意図したものではなく、またこれらに該当するものでもありません。詳細は利用規約をご覧ください。
Pine Script Developer • Market Analysis
関連の投稿
免責事項
これらの情報および投稿は、TradingViewが提供または承認する金融、投資、取引、またはその他の種類の助言もしくは推奨であることを意図したものではなく、またこれらに該当するものでもありません。詳細は利用規約をご覧ください。