
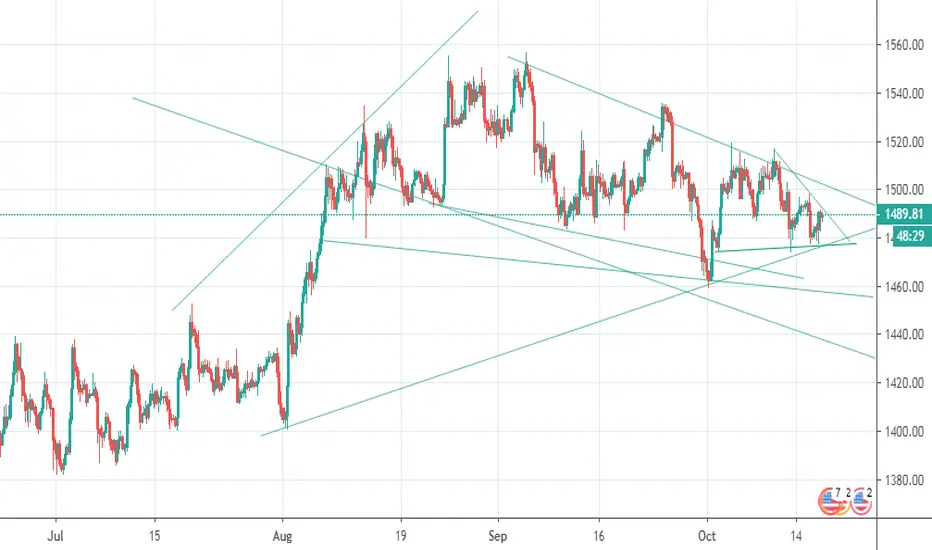
I am not so much expert but what I can see here that it is changing from flag up pattern to triangle one also towards downwards. I think from 1479. It will start falling for long term because it will break out the pattern or it will go beyond if it breaks 1502 resistance which usual one for short term. but my best suggestion goes for Short Term. Rest is upto your guys. If you like my idea then Hit up. Please suggest your views as well. I analysed on H4 and Day chart.
ノート
I will go with Short and wait until 14780-1478. Once it touches I will open a trade there. I will close half trade at 1460 and if it breaks 1458 support then I will close my rest half lot at 1440-1442. Please set your target according to that and My SL would be between 1485 and 1490.ノート
wesley.dunstan@insight.comノート
Sell at 1489 or Buy at 1502. Don't Open trade now. It is very risky and banks are going to hit both side SL for sure.ノート
ignore the email above.
免責事項
これらの情報および投稿は、TradingViewが提供または承認する金融、投資、取引、またはその他の種類の助言もしくは推奨であることを意図したものではなく、またこれらに該当するものでもありません。詳細は利用規約をご覧ください。
免責事項
これらの情報および投稿は、TradingViewが提供または承認する金融、投資、取引、またはその他の種類の助言もしくは推奨であることを意図したものではなく、またこれらに該当するものでもありません。詳細は利用規約をご覧ください。