
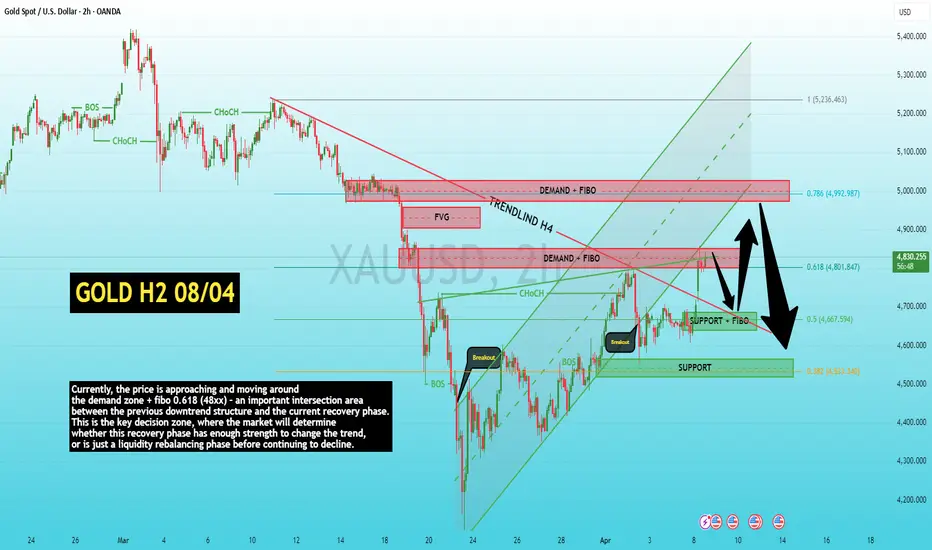
After the previous strong decline, gold has completed the process of sweeping liquidity in the low area and created a very strong reaction of more than 2000 pips from the demand zone below, thereby forming a clear recovery phase on H4. The price has broken the downtrend line and simultaneously established a recovery structure with consecutive BOS phases, indicating that short-term cash flow is shifting to a positive state.
Currently, the price is approaching and moving around the demand zone + fibo 0.618 (48xx) – an important intersection area between the previous downtrend structure and the current recovery phase. This is the key decision zone, where the market will determine whether this recovery phase has enough strength to change the trend, or is just a liquidity rebalancing phase before continuing to decline.
In terms of news, factors such as expectations of reduced military tensions, a weakening USD, and oil price adjustments are supporting gold's upward momentum. However, it should be emphasized that these are only short-term catalysts, not core factors to change the long-term trend. In many cases, these news items are tools for the market to create a liquidity spike, completing the distribution process at high price levels.
Therefore, price behavior in the 48xx–50xx zone will be decisive:
If the price holds above this zone, accumulates, and continues to create a higher structure, the deep recovery scenario will expand to the upper supply zones.
Conversely, if a strong rejection occurs, especially after major news, this will be a signal of a liquidity trap, confirming that large cash flows are taking advantage of high price zones to continue distribution.
Below, the 45xx → 43xx zone remains the main liquidity area of the market. If the decline scenario returns, this will be a potential target in the medium term, and also an area to look for buying opportunities when the market completes the adjustment process.
Trading strategy:
Prioritize observing price reactions in the 48xx zone.
Look to sell in the premium zone if clear signs of weakness appear.
Only consider buying when the price breaks & holds firmly above this structure.
The market is in a sensitive phase between breakout and liquidity trap.
News can create strong volatility, but the final direction still depends on structure and cash flow.
In the current context, maintain the mindset:
Follow structure – Not follow news.
LucasGrayTrading
Currently, the price is approaching and moving around the demand zone + fibo 0.618 (48xx) – an important intersection area between the previous downtrend structure and the current recovery phase. This is the key decision zone, where the market will determine whether this recovery phase has enough strength to change the trend, or is just a liquidity rebalancing phase before continuing to decline.
In terms of news, factors such as expectations of reduced military tensions, a weakening USD, and oil price adjustments are supporting gold's upward momentum. However, it should be emphasized that these are only short-term catalysts, not core factors to change the long-term trend. In many cases, these news items are tools for the market to create a liquidity spike, completing the distribution process at high price levels.
Therefore, price behavior in the 48xx–50xx zone will be decisive:
If the price holds above this zone, accumulates, and continues to create a higher structure, the deep recovery scenario will expand to the upper supply zones.
Conversely, if a strong rejection occurs, especially after major news, this will be a signal of a liquidity trap, confirming that large cash flows are taking advantage of high price zones to continue distribution.
Below, the 45xx → 43xx zone remains the main liquidity area of the market. If the decline scenario returns, this will be a potential target in the medium term, and also an area to look for buying opportunities when the market completes the adjustment process.
Trading strategy:
Prioritize observing price reactions in the 48xx zone.
Look to sell in the premium zone if clear signs of weakness appear.
Only consider buying when the price breaks & holds firmly above this structure.
The market is in a sensitive phase between breakout and liquidity trap.
News can create strong volatility, but the final direction still depends on structure and cash flow.
In the current context, maintain the mindset:
Follow structure – Not follow news.
LucasGrayTrading
トレード稼働中
GOLD H2 08/04 – REJECTION CONFIRMED, SELL PLAN ACTIVE DUMP 1000 PIPS TO 373XAfter the price approached the upward trendline + demand zone above (~384x), the market showed a clear rejection reaction, triggering a strong decline in line with the bias. The price quickly dumped over 1000 pips to the 373x area, confirming that the area above is no longer an accumulation zone but has turned into a short-term distribution zone.
The current structure shows that the previous recovery was merely a liquidity grab, as the price could not hold the demand zone above despite the push from news. The breakdown below and sustained selling pressure indicate that the sell side is regaining control of the market.
At this time, the price is moving towards the support + fibo area below (~36xx–37xx) – this is an area where a technical recovery reaction may occur. However, in the context of a weakening structure, upward recoveries will continue to be opportunities for the sell side to re-enter the market.
Main scenario:
Price recovers slightly → retests the 38xx area → continues to decline to deeper liquidity zones.
Bias: Predominantly sell
Strategy: Look to sell at recovery areas (rejection / weak structure)
Key levels:
384x (supply zone / trigger point for decline)
373x (current reaction area)
36xx → 34xx (next target area)
トレード終了: 利益確定目標に到達
1400 PIPS DUMP – MARKET FOLLOWED THE PLAN BIAS 08/041400 pips were completed exactly as per the bias of the plan 08/04. After the breakout increase, the price approached the demand zone + fibo above (~48xx) but could not maintain the structure, confirming this was merely a liquidity grab rather than actual accumulation.
The reaction at this zone was very clear: the price was strongly rejected, breaking the short-term structure again and dropping faster than 1400 pips, returning to the H4 downtrend line. This completes a typical market cycle: breakout → trap → continuation, while reinforcing the medium-term downtrend that is still in control.
Currently, the price is reacting around the support + fibo zone (~46xx). This is a zone that can create a technical rebound, but with the structure above having been broken and turned into a distribution zone, rebounds should still be seen as opportunities to continue participating in the downtrend.
The main scenario remains unchanged: the price rebounds to retest the 47xx–48xx zone → rejection signals appear → continuation down to lower liquidity zones, targeting 45xx and deeper to 43xx.
The market has shown clearly: when the price cannot hold the high zone after a strong breakout, it is not strength — but a sign of distribution and preparation for a deeper decline.
ノート
UPDATE 08/04 – DECLINE COMPLETED ACCORDING TO BIASThe price reacted precisely at the upper demand zone combined with an important technical structure, which was previously expected to be a distribution zone rather than accumulation. As soon as it hit this area, the buying force was insufficient to sustain, the market immediately rejected and formed a clear decline – reaffirming the view that the rebounds were merely "liquidity pulls" before continuing the main trend.
The subsequent decline occurred smoothly according to the structure, bringing the price back to the lower support zone, coinciding with the previously broken H4 downtrend line. This is a very noteworthy technical area, as it acts as a retest point of the structure after the breakout – where the market often decides to continue or create a rebound.
Currently, the price is fluctuating around this area with relatively cautious reactions. If the buying force is strong enough to hold the support area + trendline, there is a high possibility of a technical rebound back to the upper zone. However, it should be emphasized that these rebounds, in the current context, should still be seen as opportunities for the market to redistribute.
Conversely, if this support zone is decisively broken, the downtrend structure will continue to be reinforced, opening up room for a deeper decline to lower liquidity zones.
The overall picture hasn't changed much: the market is still moving in a correction phase after peaking, with upper demand zones continuously being rejected, indicating that large capital is not ready to push the price further. Previous increases were more of "liquidity traps" rather than the start of a sustainable uptrend.
The bias remains unchanged: prioritize selling during rebounds, waiting for the price to return to the upper supply zones to continue following the main trend.
LucasGrayTrading

Daily trend & Supply/Demand insights 📊
👉 t.me/+cZC_DmEr3OwzOTA1
High-probability zones & structured setups
Clear scenarios for better decision-making
Trade smarter with LucasGrayTrading 🎖
👉 t.me/+cZC_DmEr3OwzOTA1
High-probability zones & structured setups
Clear scenarios for better decision-making
Trade smarter with LucasGrayTrading 🎖
免責事項
これらの情報および投稿は、TradingViewが提供または承認する金融、投資、取引、またはその他の種類の助言もしくは推奨であることを意図したものではなく、またこれらに該当するものでもありません。詳細は利用規約をご覧ください。
Daily trend & Supply/Demand insights 📊
👉 t.me/+cZC_DmEr3OwzOTA1
High-probability zones & structured setups
Clear scenarios for better decision-making
Trade smarter with LucasGrayTrading 🎖
👉 t.me/+cZC_DmEr3OwzOTA1
High-probability zones & structured setups
Clear scenarios for better decision-making
Trade smarter with LucasGrayTrading 🎖
免責事項
これらの情報および投稿は、TradingViewが提供または承認する金融、投資、取引、またはその他の種類の助言もしくは推奨であることを意図したものではなく、またこれらに該当するものでもありません。詳細は利用規約をご覧ください。