
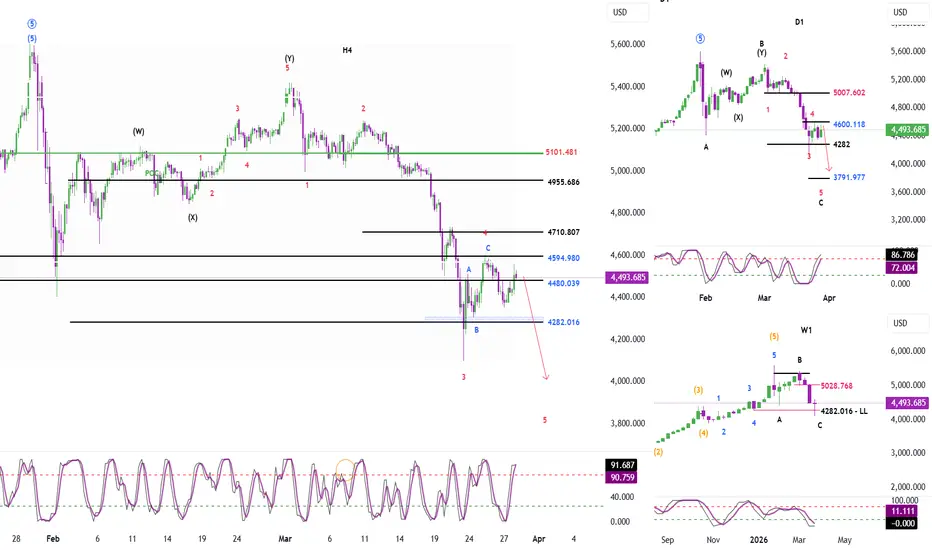
Momentum
– Weekly (W1) momentum is currently preparing to reverse
→ If this week’s candle continues to close bullish
→ It will confirm a reversal in weekly momentum
→ At that point:
– The corrective move of wave C is likely to be completed
– The entire correction phase may end
– And the market could begin a new trend
– Daily (D1) momentum is currently in the oversold zone and preparing to reverse
→ In the next 1–2 days, especially if tomorrow’s daily candle confirms
→ There is a high probability the market will continue the downtrend for the rest of the week
– H4 momentum is decreasing
→ This reflects the momentum from Friday’s closing session
→ Therefore, there is a high probability of a downward move when the market opens tomorrow
Wave Structure
– On W1:
→ The current structure is ABC
→ The minimum target of wave C has been completed
→ If W1 momentum confirms a reversal on the next weekly close
→ The market is likely to transition into a new bullish structure
– On D1:
→ Within wave C, a 5-wave structure (in red) is forming
→ The fact that D1 momentum is preparing to reverse suggests that wave 4 may be nearing completion
→ Expectation:
– Wave 4 could be confirmed complete on Monday or Tuesday
– After that, the final bearish wave 5 (red) may begin
→ Target zone:
– 3791
– On H4:
→ An ABC structure has been completed
→ Price is currently in a corrective upward move
→ However:
– H4 momentum is preparing to reverse downward
→ Therefore, a short-term decline is expected
→ Important note:
– D1 momentum has not yet confirmed a reversal
– We need to wait for Monday’s session to observe whether D1 momentum reverses or continues consolidating
→ Therefore, there are two possible scenarios:
Scenarios
– Scenario 1: Wave 4 continues
→ Price declines, causing H4 momentum to enter the oversold zone
→ But price still holds above 4282
→ In this case:
– Wave 4 is not yet complete
– A complex WXY structure may form
→ Then:
– A bullish move may occur to complete wave Y
→ Target: 4710
– Scenario 2: Strong decline (Wave 5 begins)
→ Price drops and approaches the 4111 zone
→ In this case:
– The market is likely entering wave 5
→ Target:
– 3791
Trading Plan
– Wait for Monday’s session open
– Observe price action and real-time momentum
→ Then:
– Identify which scenario is playing out
– Build a suitable trading plan
トレード稼働中
Elliott Wave Analysis XAUUSD – March 30, 2026
Momentum
– D1:
Momentum is showing signs of reversal.
→ We need to wait for today’s daily candle close for confirmation.
→ If confirmed, the market may enter a few days of decline or sideways movement.
– H4:
Momentum is decreasing.
→ It may take another 2–3 H4 candles to reach the oversold zone.
– H1:
Momentum is increasing.
→ In the short term, price may continue to rise or move sideways.
Wave Structure
D1:
– Wave C is forming a 5-wave structure (1–2–3–4–5).
– Price has been moving sideways for about 5 days.
– At the same time, D1 momentum is preparing to reverse.
→ This suggests Wave 4 is likely in its final phase and Wave 5 may be starting.
→ The duration of Wave 5 may coincide with D1 momentum moving into the oversold zone and reversing upward.
H4:
– Price has retraced and is approaching the 4600 level (a key zone).
→ If price breaks above 4600:
→ It will confirm that Wave 4 is still continuing.
→ At this stage, we should monitor H4 momentum:
– If each reversal creates lower highs and lower lows
→ It confirms the bearish structure of Wave 5.
H1:
– Price is currently at the 4480 resistance zone.
– Meanwhile:
H4 momentum is decreasing
H1 momentum is increasing
→ If price continues to move sideways here until H1 reaches overbought:
→ A short-term H1 top is likely to form.
→ If H1 becomes overbought and price reaches 4600:
→ Stay patient, as Wave 4 may still be extending
→ Price could continue higher toward the 4710 zone.
Short-Term Expectation
– Priority scenario: bearish move following H4 momentum.
– When H4 reaches the oversold zone:
→ Price may approach the 4308 area.
→ This is a strong Buy zone based on H4 momentum recovery.
Trading Plan
Entry Conditions:
– H4 momentum reaches oversold
– H1 momentum reaches oversold
– Price approaches the 4308 zone
Buy Zone: 4309 – 4307
SL: 4284
TP1: 4356
TP2: 4480
TP3: 4600

📢 Sometimes signals appear on TradingView with a slight delay!
🚀 Join our Telegram channel to get instant updates and real-time scalping signals:
👉 t.me/+lASNLyXKqcFiYmJl
🚀 Join our Telegram channel to get instant updates and real-time scalping signals:
👉 t.me/+lASNLyXKqcFiYmJl
関連の投稿
免責事項
これらの情報および投稿は、TradingViewが提供または承認する金融、投資、取引、またはその他の種類の助言もしくは推奨であることを意図したものではなく、またこれらに該当するものでもありません。詳細は利用規約をご覧ください。
📢 Sometimes signals appear on TradingView with a slight delay!
🚀 Join our Telegram channel to get instant updates and real-time scalping signals:
👉 t.me/+lASNLyXKqcFiYmJl
🚀 Join our Telegram channel to get instant updates and real-time scalping signals:
👉 t.me/+lASNLyXKqcFiYmJl
関連の投稿
免責事項
これらの情報および投稿は、TradingViewが提供または承認する金融、投資、取引、またはその他の種類の助言もしくは推奨であることを意図したものではなく、またこれらに該当するものでもありません。詳細は利用規約をご覧ください。