
Gold is currently showing a very “uncomfortable” picture — a typical market in a probing phase. After the recent recovery driven by short-term catalysts such as a weaker USD, declining oil prices, and easing geopolitical tensions, price has required significant time and effort to move upward. However, the key observation is that upside moves are slow and lack conviction, while downside moves remain sharp and decisive — a classic sign of a market gradually weakening in terms of underlying liquidity.
From a macro perspective, the recession narrative has not disappeared; it is only being temporarily overshadowed by short-term news. Large capital is not aggressively flowing into gold as a strong safe-haven asset. Instead, what we are seeing is a market in a waiting phase, where money is observing and positioning for better opportunities. This explains why gold has been stuck in a range despite multiple supportive headlines.
Notably, tonight’s Core Retail Sales and Retail Sales (USD) data will act as a key catalyst for volatility. However, from a Lucas perspective, the focus is not on whether the data is good or bad, but on how price reacts after the release. If the data comes out strong but gold fails to sustain upward momentum, it would confirm that buy-side strength is weak and the market is leaning toward distribution. On the other hand, if price is pushed higher into the 48xx–49xx zone, it is more likely a liquidity grab and FOMO trigger, rather than a sustainable bullish continuation.
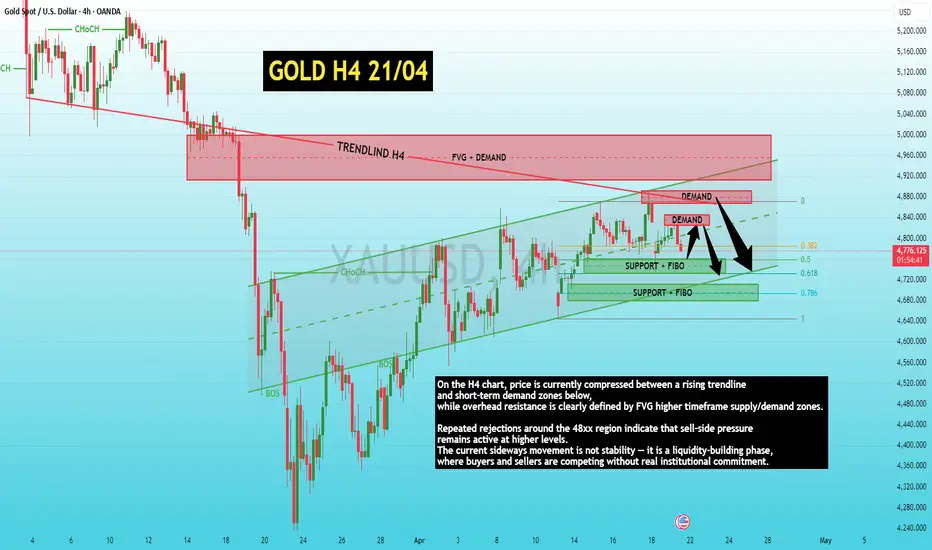
On the H4 chart, price is currently compressed between a rising trendline and short-term demand zones below, while overhead resistance is clearly defined by FVG + higher timeframe supply/demand zones. Repeated rejections around the 48xx region indicate that sell-side pressure remains active at higher levels. The current sideways movement is not stability — it is a liquidity-building phase, where buyers and sellers are competing without real institutional commitment.
The primary scenario remains unchanged: gold likely needs a push toward the upper zones (48xx–49xx) to sweep liquidity and trigger retail FOMO, before a more decisive move unfolds. If the lower demand + trendline structure breaks, it would confirm a continuation of the bearish structure, with price targeting deeper support + Fibonacci zones as outlined in the plan.
In summary, this is not a trending environment yet — it is a pre-expansion phase. Tonight’s news may act as the trigger, but the real direction will still be dictated by liquidity. From a Lucas perspective, the quieter and more compressed the market becomes, the more explosive the breakout tends to be — and for now, the higher timeframe bias still leans toward sell, as gold continues to struggle to show real strength at elevated levels.
LucasGrayTrading
From a macro perspective, the recession narrative has not disappeared; it is only being temporarily overshadowed by short-term news. Large capital is not aggressively flowing into gold as a strong safe-haven asset. Instead, what we are seeing is a market in a waiting phase, where money is observing and positioning for better opportunities. This explains why gold has been stuck in a range despite multiple supportive headlines.
Notably, tonight’s Core Retail Sales and Retail Sales (USD) data will act as a key catalyst for volatility. However, from a Lucas perspective, the focus is not on whether the data is good or bad, but on how price reacts after the release. If the data comes out strong but gold fails to sustain upward momentum, it would confirm that buy-side strength is weak and the market is leaning toward distribution. On the other hand, if price is pushed higher into the 48xx–49xx zone, it is more likely a liquidity grab and FOMO trigger, rather than a sustainable bullish continuation.
On the H4 chart, price is currently compressed between a rising trendline and short-term demand zones below, while overhead resistance is clearly defined by FVG + higher timeframe supply/demand zones. Repeated rejections around the 48xx region indicate that sell-side pressure remains active at higher levels. The current sideways movement is not stability — it is a liquidity-building phase, where buyers and sellers are competing without real institutional commitment.
The primary scenario remains unchanged: gold likely needs a push toward the upper zones (48xx–49xx) to sweep liquidity and trigger retail FOMO, before a more decisive move unfolds. If the lower demand + trendline structure breaks, it would confirm a continuation of the bearish structure, with price targeting deeper support + Fibonacci zones as outlined in the plan.
In summary, this is not a trending environment yet — it is a pre-expansion phase. Tonight’s news may act as the trigger, but the real direction will still be dictated by liquidity. From a Lucas perspective, the quieter and more compressed the market becomes, the more explosive the breakout tends to be — and for now, the higher timeframe bias still leans toward sell, as gold continues to struggle to show real strength at elevated levels.
LucasGrayTrading
トレード稼働中
GOLD UPDATE | LOSS OF MOMENTUM BELOW 4800Gold continues to show weakness as it failed to hold above the 4800 level. Following the news, the price reacted as expected → falling to the support zone + 0.5–0.618 Fibonacci level as planned.
The current configuration remains sideways but weak, with weak rebounds while the declines are faster and clearer.
The plan is still working:
Price rebound at the support zone → a technical rebound may occur.
However, the upper zone still has strong supply/demand → prioritize selling based on bias.
Keywords: loss of 4800 = loss of upward momentum
→ The main trend has not changed, continue waiting to sell at higher levels.
Market reaction confirms this plan. The trend remains sell.
トレード終了: 利益確定目標に到達
Gold initially bounced up from the 0.5-0.618 Fibonacci support zone, then broke down to the 0.786 level to sweep liquidity below. However, instead of continuing to fall, the price rebounded sharply by approximately 1000 pips from the bottom, indicating a false break/liquidity sweep.After this move, the 0.5-0.618 zone ceased to be pure support and shifted its role to a demand zone after the breakout (flip zone), acting as a short-term price support. The price continued to move sideways with the lower boundary holding firm, and the downward pushes were primarily liquidity sweeps.
The current structure shows:
The market is still in a consolidation phase, with no large capital flows determining the trend.
Breakdowns haven't been strong enough for a follow-through.
Meanwhile, support continues to appear below → indicating boundary consolidation.
➡️ Short-term: Sideways movement / slight sideways upward within the range.
➡️ Medium-term: Still prefer selling in the upper zone (48xx – demand + trendline) when the price approaches the liquidity zone again.
Wait for today's plan to determine the optimal entry point within the boundary.

Daily trend & Supply/Demand insights 📊
👉 t.me/+cZC_DmEr3OwzOTA1
High-probability zones & structured setups
Clear scenarios for better decision-making
Trade smarter with LucasGrayTrading 🎖
👉 t.me/+cZC_DmEr3OwzOTA1
High-probability zones & structured setups
Clear scenarios for better decision-making
Trade smarter with LucasGrayTrading 🎖
免責事項
これらの情報および投稿は、TradingViewが提供または承認する金融、投資、取引、またはその他の種類の助言もしくは推奨であることを意図したものではなく、またこれらに該当するものでもありません。詳細は利用規約をご覧ください。
Daily trend & Supply/Demand insights 📊
👉 t.me/+cZC_DmEr3OwzOTA1
High-probability zones & structured setups
Clear scenarios for better decision-making
Trade smarter with LucasGrayTrading 🎖
👉 t.me/+cZC_DmEr3OwzOTA1
High-probability zones & structured setups
Clear scenarios for better decision-making
Trade smarter with LucasGrayTrading 🎖
免責事項
これらの情報および投稿は、TradingViewが提供または承認する金融、投資、取引、またはその他の種類の助言もしくは推奨であることを意図したものではなく、またこれらに該当するものでもありません。詳細は利用規約をご覧ください。