
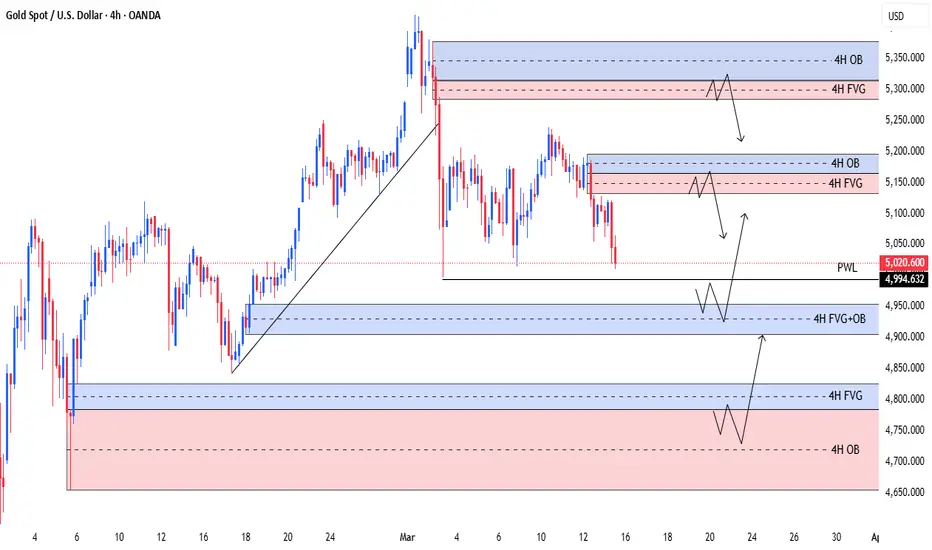
Gold is currently showing signs of weak momentum after a strong bullish expansion, and price is now rotating inside a corrective structure. The chart highlights several 4H order blocks and fair value gaps (FVGs) that could act as reaction zones.
Market Structure
The strong bullish impulse created a liquidity sweep near the highs, followed by a sharp rejection.
Since that rejection, price has been forming lower highs, suggesting weakening bullish pressure.
The market is currently approaching the previous weekly low (PWL) area, which could act as a liquidity target.
Key Supply Zones
Two important supply areas are visible on the chart:
1️⃣ Upper 4H Supply (OB + FVG)
Around 5,300 – 5,340
Confluence of a 4H Order Block and Fair Value Gap
If price retraces into this zone, sellers may look for rejection signals.
2️⃣ Mid Supply Zone
Around 5,140 – 5,180
Another 4H OB + FVG confluence
This area could provide a lower-risk short reaction if price retraces.
Liquidity & Targets
If bearish momentum continues:
First liquidity area: Previous Weekly Low (~5,000)
Next potential imbalance fill: 4H FVG + OB around 4,900
Deeper discount zone: 4H FVG near 4,800
These levels represent areas where price may react or rebalance inefficiencies.
Possible Scenario
A common scenario in this structure could be:
Price retraces into a 4H supply zone (FVG / OB)
Sellers defend the area with rejection wicks or structure shift
Price rotates lower toward PWL liquidity and lower imbalance zones
Important Note
This analysis is educational and scenario-based, not financial advice. Markets remain highly dynamic, so confirmation through price action and risk management is essential.
✅ Short idea concept:
Look for potential bearish reactions from 4H supply zones while monitoring liquidity around the previous weekly low.
Market Structure
The strong bullish impulse created a liquidity sweep near the highs, followed by a sharp rejection.
Since that rejection, price has been forming lower highs, suggesting weakening bullish pressure.
The market is currently approaching the previous weekly low (PWL) area, which could act as a liquidity target.
Key Supply Zones
Two important supply areas are visible on the chart:
1️⃣ Upper 4H Supply (OB + FVG)
Around 5,300 – 5,340
Confluence of a 4H Order Block and Fair Value Gap
If price retraces into this zone, sellers may look for rejection signals.
2️⃣ Mid Supply Zone
Around 5,140 – 5,180
Another 4H OB + FVG confluence
This area could provide a lower-risk short reaction if price retraces.
Liquidity & Targets
If bearish momentum continues:
First liquidity area: Previous Weekly Low (~5,000)
Next potential imbalance fill: 4H FVG + OB around 4,900
Deeper discount zone: 4H FVG near 4,800
These levels represent areas where price may react or rebalance inefficiencies.
Possible Scenario
A common scenario in this structure could be:
Price retraces into a 4H supply zone (FVG / OB)
Sellers defend the area with rejection wicks or structure shift
Price rotates lower toward PWL liquidity and lower imbalance zones
Important Note
This analysis is educational and scenario-based, not financial advice. Markets remain highly dynamic, so confirmation through price action and risk management is essential.
✅ Short idea concept:
Look for potential bearish reactions from 4H supply zones while monitoring liquidity around the previous weekly low.

関連の投稿
免責事項
これらの情報および投稿は、TradingViewが提供または承認する金融、投資、取引、またはその他の種類の助言もしくは推奨であることを意図したものではなく、またこれらに該当するものでもありません。詳細は利用規約をご覧ください。
関連の投稿
免責事項
これらの情報および投稿は、TradingViewが提供または承認する金融、投資、取引、またはその他の種類の助言もしくは推奨であることを意図したものではなく、またこれらに該当するものでもありません。詳細は利用規約をご覧ください。