
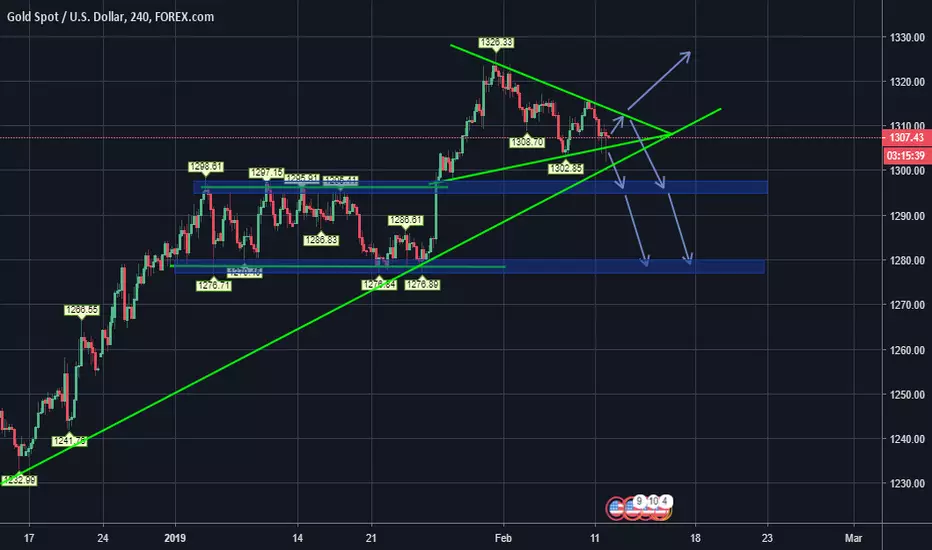
A pennant triangle has formed indicating that price action will break out either above market price or below.
Seeing as gold is currently trading at market highs, the stall in price action suggests it is losing bullish momentum and could therefore break downwards towards precious Support.
Or as due to the longer term bullish trend line it could continue higher to new structure highs and therefore continue bullish trend.
The blue arrows denote possible price action based on the Pennant pattern.
Seeing as gold is currently trading at market highs, the stall in price action suggests it is losing bullish momentum and could therefore break downwards towards precious Support.
Or as due to the longer term bullish trend line it could continue higher to new structure highs and therefore continue bullish trend.
The blue arrows denote possible price action based on the Pennant pattern.
ノート
Pennant broke Bullish.
免責事項
これらの情報および投稿は、TradingViewが提供または承認する金融、投資、取引、またはその他の種類の助言もしくは推奨であることを意図したものではなく、またこれらに該当するものでもありません。詳細は利用規約をご覧ください。
免責事項
これらの情報および投稿は、TradingViewが提供または承認する金融、投資、取引、またはその他の種類の助言もしくは推奨であることを意図したものではなく、またこれらに該当するものでもありません。詳細は利用規約をご覧ください。