
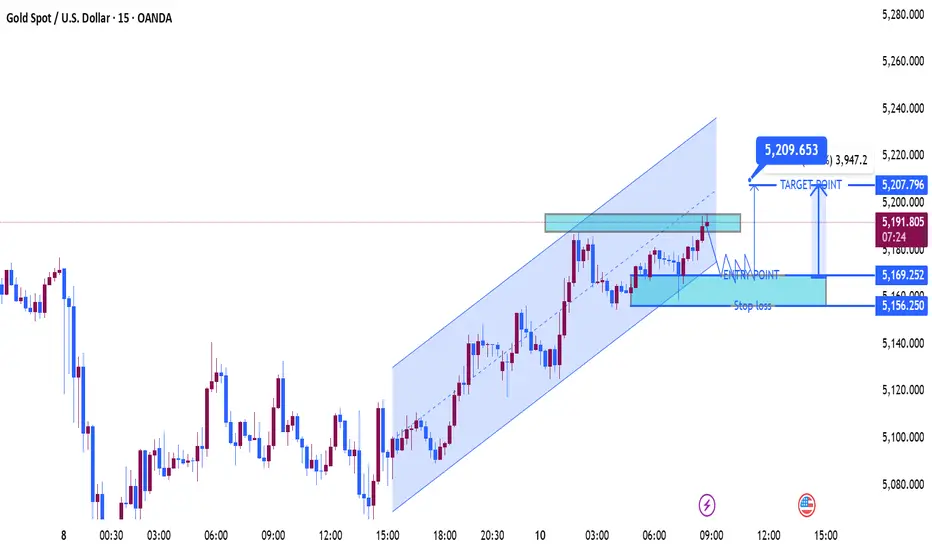
Overall Market Structure
Price is moving inside a bullish ascending channel.
The trend is higher highs + higher lows, confirming short-term bullish momentum.
Price is currently near channel resistance and a supply zone.
This means:
Momentum = bullish
Location = potential resistance
So the market is at a decision point.
🟦 Key Zones on Your Chart
Resistance / Supply Zone
5195 – 5200
Multiple candle rejections occurred here.
Sellers previously entered this level.
A breakout above this zone can trigger momentum continuation.
Entry Zone (Pullback Buy)
5169
This area is:
Previous structure support
Mid-channel demand
Liquidity pullback zone
This is a safer long entry area than chasing the top.
Stop Loss
5156
Reason:
Below structure support
Below demand zone
Break = bullish structure invalidated
Target
5207 – 5209
This aligns with:
Channel resistance
Liquidity above highs
Measured move continuation
📊 Trade Idea Logic
Scenario 1 — Pullback Buy (Safer)
1️⃣ Price pulls back to 5169 demand zone
2️⃣ Bullish confirmation (strong candle / rejection)
3️⃣ Target 5207+
Risk-to-Reward ≈ 1 : 2.5
Scenario 2 — Breakout Buy
If price breaks and closes above 5200, expect:
Next liquidity zones:
5215
5230
5240
But breakout trades carry higher fakeout risk.
⚠️ Bearish Scenario
Bullish idea fails if:
Price breaks below 5156
Channel support breaks
Then downside targets become:
5140
5125
5100
🧠 Smart Money View
What institutions often do here:
1️⃣ Sweep liquidity above 5200
2️⃣ Fake breakout
3️⃣ Retrace to 5165–5170 demand
4️⃣ Then continue higher
So patience for pullback = better probability.
✅ Summary
Level Role
5200 Resistance / Liquidity
5169 Buy Entry Zone
5156 Stop Loss
5207+ Target
Bias: Bullish while above 5156
Price is moving inside a bullish ascending channel.
The trend is higher highs + higher lows, confirming short-term bullish momentum.
Price is currently near channel resistance and a supply zone.
This means:
Momentum = bullish
Location = potential resistance
So the market is at a decision point.
🟦 Key Zones on Your Chart
Resistance / Supply Zone
5195 – 5200
Multiple candle rejections occurred here.
Sellers previously entered this level.
A breakout above this zone can trigger momentum continuation.
Entry Zone (Pullback Buy)
5169
This area is:
Previous structure support
Mid-channel demand
Liquidity pullback zone
This is a safer long entry area than chasing the top.
Stop Loss
5156
Reason:
Below structure support
Below demand zone
Break = bullish structure invalidated
Target
5207 – 5209
This aligns with:
Channel resistance
Liquidity above highs
Measured move continuation
📊 Trade Idea Logic
Scenario 1 — Pullback Buy (Safer)
1️⃣ Price pulls back to 5169 demand zone
2️⃣ Bullish confirmation (strong candle / rejection)
3️⃣ Target 5207+
Risk-to-Reward ≈ 1 : 2.5
Scenario 2 — Breakout Buy
If price breaks and closes above 5200, expect:
Next liquidity zones:
5215
5230
5240
But breakout trades carry higher fakeout risk.
⚠️ Bearish Scenario
Bullish idea fails if:
Price breaks below 5156
Channel support breaks
Then downside targets become:
5140
5125
5100
🧠 Smart Money View
What institutions often do here:
1️⃣ Sweep liquidity above 5200
2️⃣ Fake breakout
3️⃣ Retrace to 5165–5170 demand
4️⃣ Then continue higher
So patience for pullback = better probability.
✅ Summary
Level Role
5200 Resistance / Liquidity
5169 Buy Entry Zone
5156 Stop Loss
5207+ Target
Bias: Bullish while above 5156
トレード終了: 利益確定目標に到達

join my telegram channel t.me/goldsignalicthttps://t.me/goldsignalicthttps://t.me/goldsignalict
免責事項
これらの情報および投稿は、TradingViewが提供または承認する金融、投資、取引、またはその他の種類の助言もしくは推奨であることを意図したものではなく、またこれらに該当するものでもありません。詳細は利用規約をご覧ください。
join my telegram channel t.me/goldsignalicthttps://t.me/goldsignalicthttps://t.me/goldsignalict
免責事項
これらの情報および投稿は、TradingViewが提供または承認する金融、投資、取引、またはその他の種類の助言もしくは推奨であることを意図したものではなく、またこれらに該当するものでもありません。詳細は利用規約をご覧ください。