
Hello.
It’s BitcoinGuide.
Please “Follow” me and press “Likes”.
I will begin XAUUSD Gold Chart Analysis for December 12th
This shows GBPUSD 30m candle chart for yesterday.
It moved from route B to A. Stop loss was at green parallel resistance line.
So, the strategy failed yesterday.
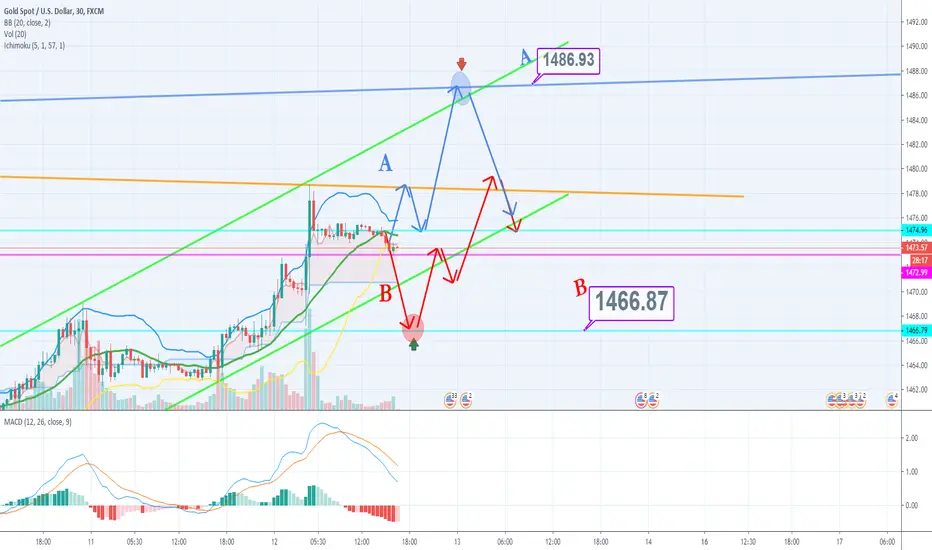
Today we have XAUUSD Gold 30m candle chart.
Recently, we frequently see strong trend in FX market.
So, I calculated the wave a bit bigger than usual.
To summarize,
1. Please see route A & B with each entry timing and price point.
2. When you enter long position on route A, if it goes down below the entry point, please refer to route B.
3. In case of route B, when you enter long position, please carefully look at the first adjustment. When the price falls strong, close your position.
This is it.
Currently, we are at downtrend signal.
As a whole, however, the uptrend seems strong for now. So, I brought a strategy according to it.
Recently, we usually see strong trend. So please don’t be hesitant. And enter your position as you planned.
Do not forget to put stop-loss.
I will come back to you tomorrow.
Thank you.
(Translation help
Jae Ho Shin)

[Bitcoin Guide Affiliate]
*Bybit 20%DC Lifetime + $30,100
partner.bybit.com/b/Bitcoin_Guide
*BingX 50%DC + $14,100
bit.ly/3E8ZkAW
*ZeroMarket ECN 40%DC
bit.ly/3pY0dUv
*Telegram
t.me/bitcoinguide_TM
*Bybit 20%DC Lifetime + $30,100
partner.bybit.com/b/Bitcoin_Guide
*BingX 50%DC + $14,100
bit.ly/3E8ZkAW
*ZeroMarket ECN 40%DC
bit.ly/3pY0dUv
*Telegram
t.me/bitcoinguide_TM
関連の投稿
免責事項
これらの情報および投稿は、TradingViewが提供または承認する金融、投資、取引、またはその他の種類の助言もしくは推奨であることを意図したものではなく、またこれらに該当するものでもありません。詳細は利用規約をご覧ください。
[Bitcoin Guide Affiliate]
*Bybit 20%DC Lifetime + $30,100
partner.bybit.com/b/Bitcoin_Guide
*BingX 50%DC + $14,100
bit.ly/3E8ZkAW
*ZeroMarket ECN 40%DC
bit.ly/3pY0dUv
*Telegram
t.me/bitcoinguide_TM
*Bybit 20%DC Lifetime + $30,100
partner.bybit.com/b/Bitcoin_Guide
*BingX 50%DC + $14,100
bit.ly/3E8ZkAW
*ZeroMarket ECN 40%DC
bit.ly/3pY0dUv
*Telegram
t.me/bitcoinguide_TM
関連の投稿
免責事項
これらの情報および投稿は、TradingViewが提供または承認する金融、投資、取引、またはその他の種類の助言もしくは推奨であることを意図したものではなく、またこれらに該当するものでもありません。詳細は利用規約をご覧ください。