
XAU/USD (Gold) 15M Technical Analysis
Bias: Bullish Continuation After Pullback
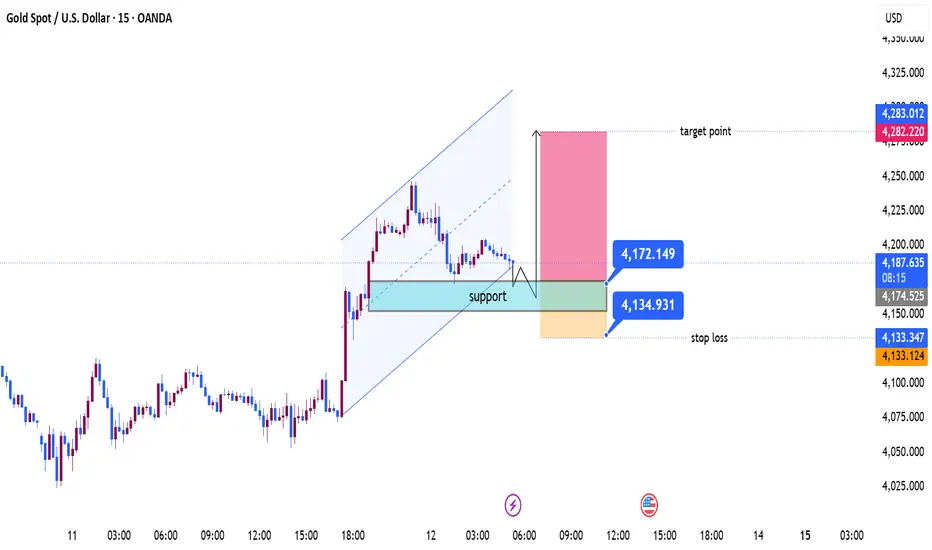
The chart shows gold correcting within a recently broken bullish channel and approaching a key support zone between 4172 – 4135. Price is currently trading around 4185, just above the highlighted demand area.
Key Observations
A strong impulsive bullish move pushed price from the 4070s toward 4240+.
The current decline appears to be a healthy retracement rather than a trend reversal.
The marked support zone (4172–4135) aligns with:
Previous consolidation area
Channel retest region
Potential institutional demand zone
Trade Idea
Buy Zone: 4172 – 4135
Stop Loss: 4133
Target: 4282 – 4283
Bullish Scenario
If buyers defend the support area, a bullish rebound could develop.
A higher low formation on the 15-minute timeframe would strengthen the long setup.
Breaking above recent intraday highs around 4200–4210 could accelerate momentum toward 4283.
Bearish Risk
A decisive close below 4135 would invalidate the setup.
In that case, price could extend lower toward the next support levels near 4110–4090.
Risk-to-Reward
Approximate Risk: 39 points
Potential Reward: 110 points
Risk-to-Reward Ratio: ~1:2.8, which is favorable if support holds.
Bias: Bullish Continuation After Pullback
The chart shows gold correcting within a recently broken bullish channel and approaching a key support zone between 4172 – 4135. Price is currently trading around 4185, just above the highlighted demand area.
Key Observations
A strong impulsive bullish move pushed price from the 4070s toward 4240+.
The current decline appears to be a healthy retracement rather than a trend reversal.
The marked support zone (4172–4135) aligns with:
Previous consolidation area
Channel retest region
Potential institutional demand zone
Trade Idea
Buy Zone: 4172 – 4135
Stop Loss: 4133
Target: 4282 – 4283
Bullish Scenario
If buyers defend the support area, a bullish rebound could develop.
A higher low formation on the 15-minute timeframe would strengthen the long setup.
Breaking above recent intraday highs around 4200–4210 could accelerate momentum toward 4283.
Bearish Risk
A decisive close below 4135 would invalidate the setup.
In that case, price could extend lower toward the next support levels near 4110–4090.
Risk-to-Reward
Approximate Risk: 39 points
Potential Reward: 110 points
Risk-to-Reward Ratio: ~1:2.8, which is favorable if support holds.

join my telegram channel t.me/goldsignalicthttps://t.me/goldsignalicthttps://t.me/goldsignalict
免責事項
これらの情報および投稿は、TradingViewが提供または承認する金融、投資、取引、またはその他の種類の助言もしくは推奨であることを意図したものではなく、またこれらに該当するものでもありません。詳細は利用規約をご覧ください。
join my telegram channel t.me/goldsignalicthttps://t.me/goldsignalicthttps://t.me/goldsignalict
免責事項
これらの情報および投稿は、TradingViewが提供または承認する金融、投資、取引、またはその他の種類の助言もしくは推奨であることを意図したものではなく、またこれらに該当するものでもありません。詳細は利用規約をご覧ください。