
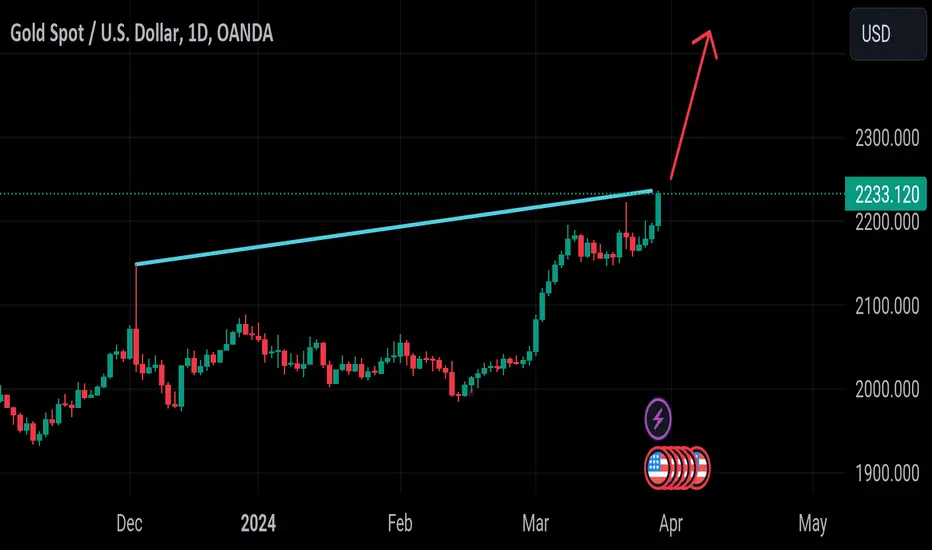
While bullion’s technical profile continues to be bullish, with a clear pattern of higher highs and higher lows, caution is advised, with the 10-week RSI indicator signaling possible overbought conditions. When markets become overextended in a short period of time, corrective pullbacks often follow, even if they turn out to be temporary or relatively minor.
In the event of a bearish shift, support can be identified at $2,145, followed by $2,070, as displayed in the weekly chart attached. Bulls will need to vigorously defend this technical floor; failure to do so may result in a retracement towards the 200-day simple moving average near $1,985. Further down
In the event of a bearish shift, support can be identified at $2,145, followed by $2,070, as displayed in the weekly chart attached. Bulls will need to vigorously defend this technical floor; failure to do so may result in a retracement towards the 200-day simple moving average near $1,985. Further down

免責事項
これらの情報および投稿は、TradingViewが提供または承認する金融、投資、取引、またはその他の種類の助言もしくは推奨であることを意図したものではなく、またこれらに該当するものでもありません。詳細は利用規約をご覧ください。
免責事項
これらの情報および投稿は、TradingViewが提供または承認する金融、投資、取引、またはその他の種類の助言もしくは推奨であることを意図したものではなく、またこれらに該当するものでもありません。詳細は利用規約をご覧ください。