 XAUUSD XAUUSD
 Structure | Trend | Key Reaction Zones
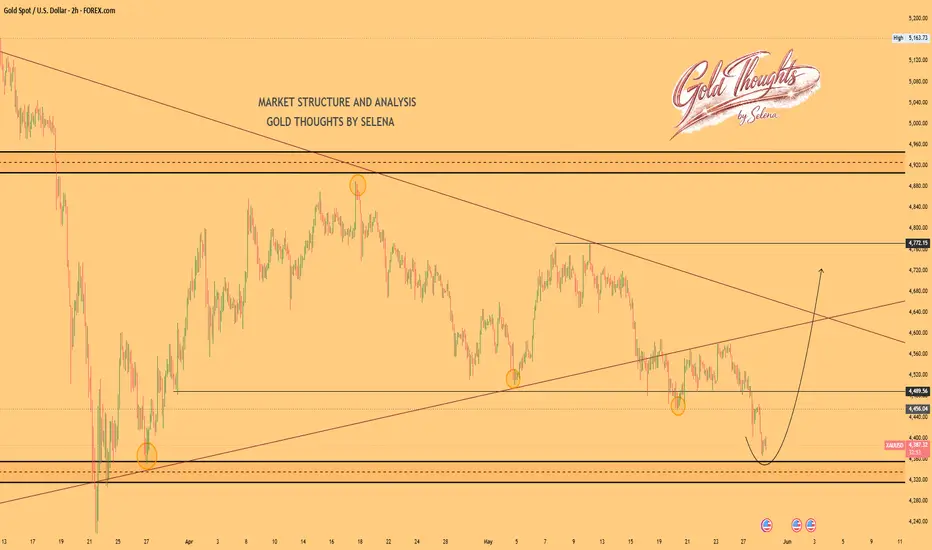
Gold is currently reacting from a strong higher timeframe demand zone while respecting the ascending support trendline. The chart structure suggests bullish recovery momentum building from support.
Market Overview
After extended bearish pressure, price has reached a key liquidity and support area where buyers previously entered the market aggressively. The projected path indicates a possible bullish rebound toward higher resistance and dynamic supply zones.
Bullish Scenario 🚀
🎯 Target 1: 4520
🎯 Target 2: 4640
🎯 Target 3: 4720
Current Levels to Watch
Resistance 🔴: 4520 → 4720
Support 🟢: 4320 → 4380
⚠️ Disclaimer: This analysis is for educational purposes only. It is not financial advice.
トレード稼働中
ノート

Selena LIVE Market Capture
And LIVE Gold Signals here
t.me/Selenaforex
And LIVE Gold Signals here
t.me/Selenaforex
関連の投稿
免責事項
これらの情報および投稿は、TradingViewが提供または承認する金融、投資、取引、またはその他の種類の助言もしくは推奨であることを意図したものではなく、またこれらに該当するものでもありません。詳細は利用規約をご覧ください。
Selena LIVE Market Capture
And LIVE Gold Signals here
t.me/Selenaforex
And LIVE Gold Signals here
t.me/Selenaforex
関連の投稿
免責事項
これらの情報および投稿は、TradingViewが提供または承認する金融、投資、取引、またはその他の種類の助言もしくは推奨であることを意図したものではなく、またこれらに該当するものでもありません。詳細は利用規約をご覧ください。