
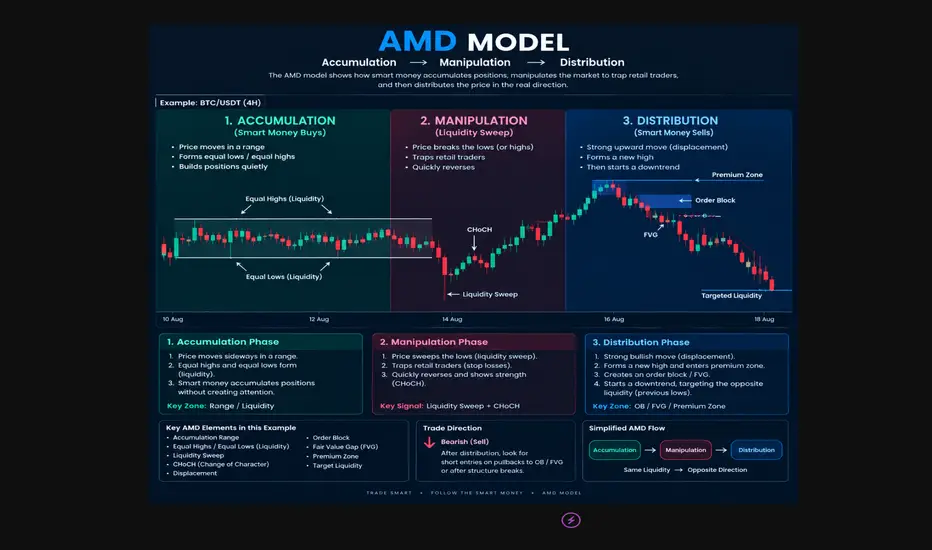
The AMD Model (Accumulation → Manipulation → Distribution) is one of the most useful frameworks for understanding how price can move through liquidity before expanding in a particular direction. Instead of looking at the market as random candles, the AMD model helps traders study the relationship between consolidation, liquidity creation, liquidity sweeps, market structure, displacement, and expansion.
The purpose of this educational chart is to demonstrate how these three phases can appear together and how traders can use them to build a structured market narrative.
1️⃣ ACCUMULATION — LIQUIDITY IS CREATED
The first phase is Accumulation.
During accumulation, price often moves sideways inside a defined trading range. The market may repeatedly test the same highs and lows, creating obvious areas of liquidity.
You may see:
• Equal Highs (EQH)
• Equal Lows (EQL)
• Previous Highs / Previous Lows
• Range High and Range Low
• Internal liquidity
• Consolidation and compression
For example, imagine BTC/USDT is trading between $60,000 and $62,000 for several sessions.
If price repeatedly reacts around $62,000, traders may place stop-losses above that level. Similarly, repeated reactions around $60,000 can create sell-side liquidity below the range.
The longer and more obvious the range becomes, the more liquidity can potentially accumulate around its boundaries.
Important: Accumulation does not automatically tell us whether the final move will be bullish or bearish. We need to observe what happens when price interacts with the liquidity.
2️⃣ MANIPULATION — LIQUIDITY SWEEP
The second phase is Manipulation.
This is where price may temporarily move beyond an obvious liquidity level.
For example, after spending several hours inside a range, price suddenly breaks below the range low and takes the sell-side liquidity.
Many traders may interpret this as a bearish breakout and enter short positions. However, if price quickly rejects the lower level and returns back inside the range, the breakout may have been a liquidity sweep rather than genuine continuation.
The opposite can happen above the range.
Price can move above equal highs, take the buy-side liquidity, and then reverse lower.
This is why a liquidity sweep should not automatically be treated as an entry signal.
A professional approach is to wait for additional confirmation, such as:
Liquidity Sweep → MSS/CHoCH → Displacement → Retracement → Entry
The market structure shift helps provide evidence that the short-term order flow may have changed.
3️⃣ DISTRIBUTION — THE EXPANSION PHASE
After liquidity has been taken and the market provides confirmation, the third phase is Distribution.
This is where price begins expanding away from the accumulation range and potentially moves toward another liquidity objective.
During distribution, traders may monitor:
• Market Structure Shift (MSS)
• Change of Character (CHoCH)
• Break of Structure (BOS)
• Strong Displacement
• Fair Value Gaps (FVG)
• Order Blocks (OB)
• Premium & Discount Zones
• Previous Highs / Lows
• External Liquidity
For example, in a bullish AMD scenario, price may accumulate inside a range, sweep the lows, shift bullish, and then expand toward the buy-side liquidity above the range.
In a bearish AMD scenario, price may accumulate, sweep the highs, shift bearish, and then distribute lower toward sell-side liquidity.
BULLISH AMD EXAMPLE
A simplified bullish sequence can look like this:
Accumulation
↓
Equal Lows form
↓
Sell-Side Liquidity builds
↓
Price sweeps the lows
↓
Bullish MSS / CHoCH
↓
Strong bullish displacement
↓
FVG / Order Block forms
↓
Price retraces into the zone
↓
Bullish continuation
↓
Target = Buy-Side Liquidity
The key idea is that the trader is not buying simply because price swept the lows.
Instead, the trader waits for evidence of bullish intent after the sweep.
BEARISH AMD EXAMPLE
A bearish sequence can look like:
Accumulation
↓
Equal Highs form
↓
Buy-Side Liquidity builds
↓
Price sweeps the highs
↓
Bearish MSS / CHoCH
↓
Strong bearish displacement
↓
FVG / Order Block forms
↓
Price retraces into the zone
↓
Bearish continuation
↓
Target = Sell-Side Liquidity
Again, the liquidity sweep itself is not enough. The objective is to combine the sweep with market structure and displacement to create a higher-quality trading narrative.
.AMD + SMC CONFLUENCE
The AMD model becomes even more useful when combined with other Smart Money Concepts.
A potential setup could be:
Liquidity → Sweep → MSS → Displacement → FVG → Order Block → Entry → Liquidity Target
For example, after a sell-side liquidity sweep, price may create a bullish displacement candle and leave behind a Fair Value Gap. If price later retraces into that FVG or a valid bullish Order Block while the overall structure remains bullish, the area may become interesting for further analysis.
The same logic can be applied in reverse for bearish setups.
The purpose of this educational chart is to demonstrate how these three phases can appear together and how traders can use them to build a structured market narrative.
1️⃣ ACCUMULATION — LIQUIDITY IS CREATED
The first phase is Accumulation.
During accumulation, price often moves sideways inside a defined trading range. The market may repeatedly test the same highs and lows, creating obvious areas of liquidity.
You may see:
• Equal Highs (EQH)
• Equal Lows (EQL)
• Previous Highs / Previous Lows
• Range High and Range Low
• Internal liquidity
• Consolidation and compression
For example, imagine BTC/USDT is trading between $60,000 and $62,000 for several sessions.
If price repeatedly reacts around $62,000, traders may place stop-losses above that level. Similarly, repeated reactions around $60,000 can create sell-side liquidity below the range.
The longer and more obvious the range becomes, the more liquidity can potentially accumulate around its boundaries.
Important: Accumulation does not automatically tell us whether the final move will be bullish or bearish. We need to observe what happens when price interacts with the liquidity.
2️⃣ MANIPULATION — LIQUIDITY SWEEP
The second phase is Manipulation.
This is where price may temporarily move beyond an obvious liquidity level.
For example, after spending several hours inside a range, price suddenly breaks below the range low and takes the sell-side liquidity.
Many traders may interpret this as a bearish breakout and enter short positions. However, if price quickly rejects the lower level and returns back inside the range, the breakout may have been a liquidity sweep rather than genuine continuation.
The opposite can happen above the range.
Price can move above equal highs, take the buy-side liquidity, and then reverse lower.
This is why a liquidity sweep should not automatically be treated as an entry signal.
A professional approach is to wait for additional confirmation, such as:
Liquidity Sweep → MSS/CHoCH → Displacement → Retracement → Entry
The market structure shift helps provide evidence that the short-term order flow may have changed.
3️⃣ DISTRIBUTION — THE EXPANSION PHASE
After liquidity has been taken and the market provides confirmation, the third phase is Distribution.
This is where price begins expanding away from the accumulation range and potentially moves toward another liquidity objective.
During distribution, traders may monitor:
• Market Structure Shift (MSS)
• Change of Character (CHoCH)
• Break of Structure (BOS)
• Strong Displacement
• Fair Value Gaps (FVG)
• Order Blocks (OB)
• Premium & Discount Zones
• Previous Highs / Lows
• External Liquidity
For example, in a bullish AMD scenario, price may accumulate inside a range, sweep the lows, shift bullish, and then expand toward the buy-side liquidity above the range.
In a bearish AMD scenario, price may accumulate, sweep the highs, shift bearish, and then distribute lower toward sell-side liquidity.
BULLISH AMD EXAMPLE
A simplified bullish sequence can look like this:
Accumulation
↓
Equal Lows form
↓
Sell-Side Liquidity builds
↓
Price sweeps the lows
↓
Bullish MSS / CHoCH
↓
Strong bullish displacement
↓
FVG / Order Block forms
↓
Price retraces into the zone
↓
Bullish continuation
↓
Target = Buy-Side Liquidity
The key idea is that the trader is not buying simply because price swept the lows.
Instead, the trader waits for evidence of bullish intent after the sweep.
BEARISH AMD EXAMPLE
A bearish sequence can look like:
Accumulation
↓
Equal Highs form
↓
Buy-Side Liquidity builds
↓
Price sweeps the highs
↓
Bearish MSS / CHoCH
↓
Strong bearish displacement
↓
FVG / Order Block forms
↓
Price retraces into the zone
↓
Bearish continuation
↓
Target = Sell-Side Liquidity
Again, the liquidity sweep itself is not enough. The objective is to combine the sweep with market structure and displacement to create a higher-quality trading narrative.
.AMD + SMC CONFLUENCE
The AMD model becomes even more useful when combined with other Smart Money Concepts.
A potential setup could be:
Liquidity → Sweep → MSS → Displacement → FVG → Order Block → Entry → Liquidity Target
For example, after a sell-side liquidity sweep, price may create a bullish displacement candle and leave behind a Fair Value Gap. If price later retraces into that FVG or a valid bullish Order Block while the overall structure remains bullish, the area may become interesting for further analysis.
The same logic can be applied in reverse for bearish setups.

Join now for FREE daily signals 👇
t.me/+h_g9EXI_KBk4MTE0
t.me/+h_g9EXI_KBk4MTE0
免責事項
これらの情報および投稿は、TradingViewが提供または承認する金融、投資、取引、またはその他の種類の助言もしくは推奨であることを意図したものではなく、またこれらに該当するものでもありません。詳細は利用規約をご覧ください。
Join now for FREE daily signals 👇
t.me/+h_g9EXI_KBk4MTE0
t.me/+h_g9EXI_KBk4MTE0
免責事項
これらの情報および投稿は、TradingViewが提供または承認する金融、投資、取引、またはその他の種類の助言もしくは推奨であることを意図したものではなく、またこれらに該当するものでもありません。詳細は利用規約をご覧ください。