
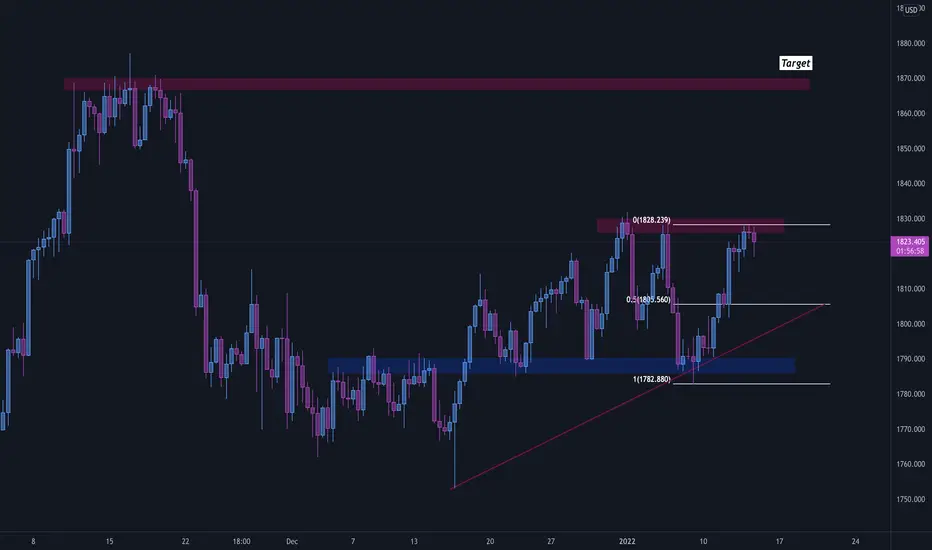
The price is currently sitting at an important level of resistance. The last few DAILY timeframe candlesticks are indicating a massive bullish pressure. As or right now, it is a bit difficult to predict whether there is a possibility for the price to drop till the 50% Fibonacci level before continuing its powerful bullish movements. However, we will keep monitoring the price action and look for more confirmations before going long and aiming for the target level indicated on the graphical illustration.
Happy trading, everyone!
Happy trading, everyone!

免責事項
これらの情報および投稿は、TradingViewが提供または承認する金融、投資、取引、またはその他の種類の助言もしくは推奨であることを意図したものではなく、またこれらに該当するものでもありません。詳細は利用規約をご覧ください。
免責事項
これらの情報および投稿は、TradingViewが提供または承認する金融、投資、取引、またはその他の種類の助言もしくは推奨であることを意図したものではなく、またこれらに該当するものでもありません。詳細は利用規約をご覧ください。