
Yesterday turned out to be a very good day for Gold bears, myself included.
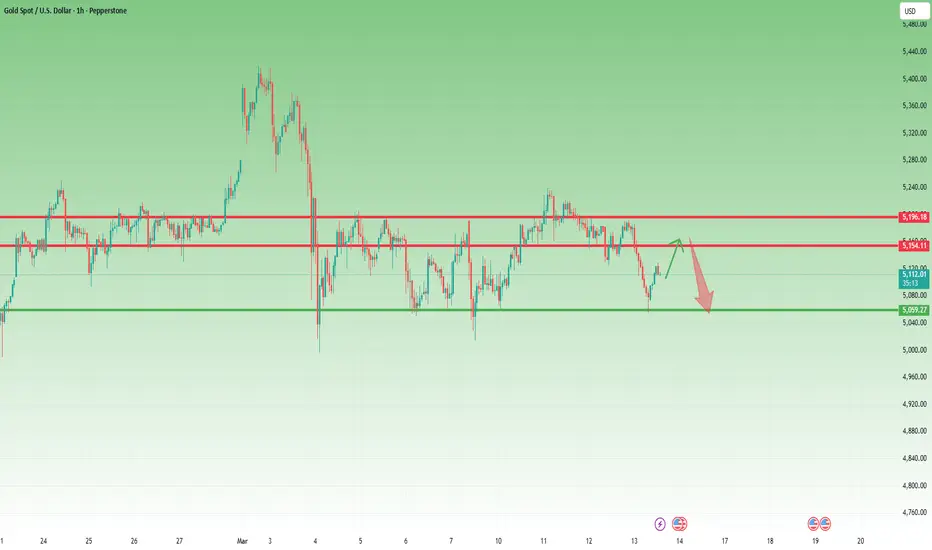
The session started with Gold pushing once again into the resistance area, repeating the pattern we’ve seen several times recently.
However, instead of breaking higher, the market began to slow down and consolidate near the top, a behavior that often signals distribution rather than accumulation.
After this short consolidation phase, sellers stepped in decisively.
What followed was eight consecutive hours of bearish price action, driving the market steadily lower until it returned to the support zone.
For my position, this move resulted in a 1200-pip profit, capturing almost the entire daily range — the kind of move traders always aim for but rarely manage to catch so cleanly.
Reaction from Support
Once the market reached support, a technical rebound naturally followed. That reaction was expected, as markets rarely move in one direction without pauses, especially after a strong impulsive move.
At the time of writing, Gold is trading around the 5115 area, showing a moderate recovery from the session’s lows.
And, as usual after such rebounds, the key question for traders becomes:
Was that the bottom? Are bulls ready to take control again?
Why the Bearish Bias Remains
In my opinion, this rebound does not mark the end of the move lower. Instead, it looks more like a typical technical retracement after a strong decline, which could eventually be followed by another wave of selling.
The key technical element supporting this view is the genuine break (this time) of the 5160 level.
Previously, 5160 acted as an important support zone, repeatedly defended by buyers. But once the market broke below it, the structure changed. From a technical standpoint, former support often turns into resistance, especially when the break happens with strong momentum.
That is exactly what we are seeing now.
The Trading Plan
Because of this structural shift, my approach remains focused on the short side.
If the market continues to rebound, the 5160 area becomes the main level to watch, as it now represents a potential sell zone where sellers could step back into the market.
As for targets, the 5050 support zone stands out as the most obvious objective if the bearish pressure resumes.
The Bigger Picture
It is also important to remember the broader structural context.
As mentioned in previous analyses, Gold cannot be considered bullish while trading below the 5200 area. That level remains the key invalidation zone for the bearish scenario.
Only a move back above 5200 would suggest that buyers are regaining control and that the bearish structure is weakening.
Conclusion
Yesterday’s price action delivered a clear bearish move, confirming once again how quickly Gold can shift.
After an extended drop and the break of 5160, the current rebound appears to be a technical pullback rather than the start of a new bullish trend.
For now, the plan remains straightforward:
- Look to sell rallies around the 5160 resistance zone
- Target the 5050 support area
- Maintain bearish bias while price remains below 5200
As always, I could be wrong, that's why I use stop loss — but for the moment, the structure still favors the bears. 🚀
The session started with Gold pushing once again into the resistance area, repeating the pattern we’ve seen several times recently.
However, instead of breaking higher, the market began to slow down and consolidate near the top, a behavior that often signals distribution rather than accumulation.
After this short consolidation phase, sellers stepped in decisively.
What followed was eight consecutive hours of bearish price action, driving the market steadily lower until it returned to the support zone.
For my position, this move resulted in a 1200-pip profit, capturing almost the entire daily range — the kind of move traders always aim for but rarely manage to catch so cleanly.
Reaction from Support
Once the market reached support, a technical rebound naturally followed. That reaction was expected, as markets rarely move in one direction without pauses, especially after a strong impulsive move.
At the time of writing, Gold is trading around the 5115 area, showing a moderate recovery from the session’s lows.
And, as usual after such rebounds, the key question for traders becomes:
Was that the bottom? Are bulls ready to take control again?
Why the Bearish Bias Remains
In my opinion, this rebound does not mark the end of the move lower. Instead, it looks more like a typical technical retracement after a strong decline, which could eventually be followed by another wave of selling.
The key technical element supporting this view is the genuine break (this time) of the 5160 level.
Previously, 5160 acted as an important support zone, repeatedly defended by buyers. But once the market broke below it, the structure changed. From a technical standpoint, former support often turns into resistance, especially when the break happens with strong momentum.
That is exactly what we are seeing now.
The Trading Plan
Because of this structural shift, my approach remains focused on the short side.
If the market continues to rebound, the 5160 area becomes the main level to watch, as it now represents a potential sell zone where sellers could step back into the market.
As for targets, the 5050 support zone stands out as the most obvious objective if the bearish pressure resumes.
The Bigger Picture
It is also important to remember the broader structural context.
As mentioned in previous analyses, Gold cannot be considered bullish while trading below the 5200 area. That level remains the key invalidation zone for the bearish scenario.
Only a move back above 5200 would suggest that buyers are regaining control and that the bearish structure is weakening.
Conclusion
Yesterday’s price action delivered a clear bearish move, confirming once again how quickly Gold can shift.
After an extended drop and the break of 5160, the current rebound appears to be a technical pullback rather than the start of a new bullish trend.
For now, the plan remains straightforward:
- Look to sell rallies around the 5160 resistance zone
- Target the 5050 support area
- Maintain bearish bias while price remains below 5200
As always, I could be wrong, that's why I use stop loss — but for the moment, the structure still favors the bears. 🚀

🎯 Want More Trading Ideas?
📈 Join the FREE Forex & Gold Channel
👉 t.me/intradaytradingsignals
💎 Join the FREE Crypto Channel
👉 t.me/FanCryptocurrency
📈 Join the FREE Forex & Gold Channel
👉 t.me/intradaytradingsignals
💎 Join the FREE Crypto Channel
👉 t.me/FanCryptocurrency
関連の投稿
免責事項
これらの情報および投稿は、TradingViewが提供または承認する金融、投資、取引、またはその他の種類の助言もしくは推奨であることを意図したものではなく、またこれらに該当するものでもありません。詳細は利用規約をご覧ください。
🎯 Want More Trading Ideas?
📈 Join the FREE Forex & Gold Channel
👉 t.me/intradaytradingsignals
💎 Join the FREE Crypto Channel
👉 t.me/FanCryptocurrency
📈 Join the FREE Forex & Gold Channel
👉 t.me/intradaytradingsignals
💎 Join the FREE Crypto Channel
👉 t.me/FanCryptocurrency
関連の投稿
免責事項
これらの情報および投稿は、TradingViewが提供または承認する金融、投資、取引、またはその他の種類の助言もしくは推奨であることを意図したものではなく、またこれらに該当するものでもありません。詳細は利用規約をご覧ください。