
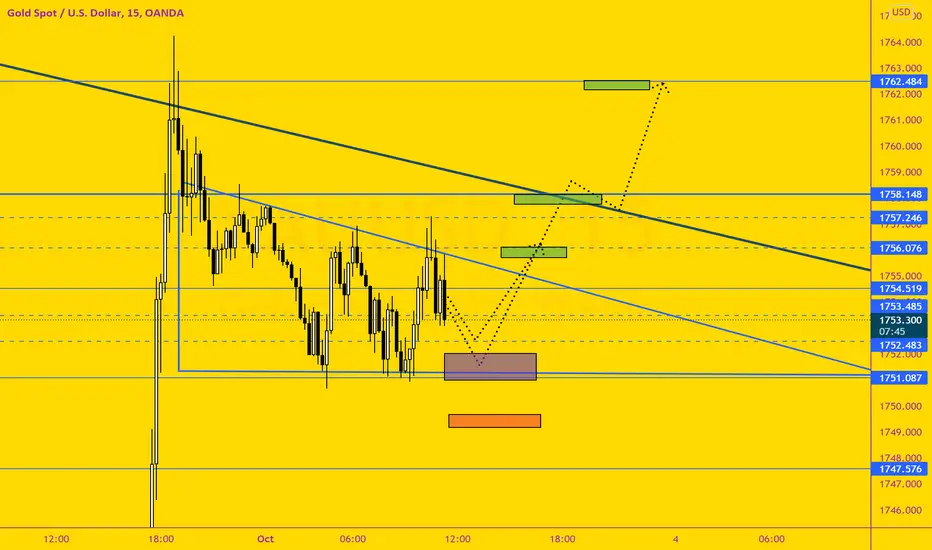
In this post, we will analyze Forex Gold with the symbol XAU / USD. We review the fundamental news and perform a technical analysis according to the modern price action method and identify the appropriate points and signals.
Fall of gold
After the price of gold fell to 1722, gold entered a short-term uptrend, causing the price to jump to $ 1762.
Descending channel
In general, at intervals of more than 2 hours, gold is still inside a bearish channel and its price growth was up to the top of the bearish channel last night.
The downside of the channel acted as a resistance, pushing the price of gold to $ 1,751.
Triangle pattern
Now, in a period of 15 minutes, we see the creation of a triangular pattern whose lower side is between 1751 and 1750.
Fundamentals
The US PMI is scheduled to be released at 17:30 Tehran time. Forex analysts forecast a 0.3% decline.
The possibility of the dollar falling
But according to Powell and Ms Yellen yesterday, the PMI is expected to be lower than expected. This will weaken the dollar and strengthen gold.
So the formed triangular pattern can mark the green dots and the gold weekend will be bullish.
Signals
Suitable entrance area: 1752 to 1751
Profit Range Suitable Range: 1755, 1757, 1760
Suitable area Loss limit: 1749.5 to 1748.5
Fall of gold
After the price of gold fell to 1722, gold entered a short-term uptrend, causing the price to jump to $ 1762.
Descending channel
In general, at intervals of more than 2 hours, gold is still inside a bearish channel and its price growth was up to the top of the bearish channel last night.
The downside of the channel acted as a resistance, pushing the price of gold to $ 1,751.
Triangle pattern
Now, in a period of 15 minutes, we see the creation of a triangular pattern whose lower side is between 1751 and 1750.
Fundamentals
The US PMI is scheduled to be released at 17:30 Tehran time. Forex analysts forecast a 0.3% decline.
The possibility of the dollar falling
But according to Powell and Ms Yellen yesterday, the PMI is expected to be lower than expected. This will weaken the dollar and strengthen gold.
So the formed triangular pattern can mark the green dots and the gold weekend will be bullish.
Signals
Suitable entrance area: 1752 to 1751
Profit Range Suitable Range: 1755, 1757, 1760
Suitable area Loss limit: 1749.5 to 1748.5
トレード稼働中
トレード終了: 利益確定目標に到達

免責事項
これらの情報および投稿は、TradingViewが提供または承認する金融、投資、取引、またはその他の種類の助言もしくは推奨であることを意図したものではなく、またこれらに該当するものでもありません。詳細は利用規約をご覧ください。
免責事項
これらの情報および投稿は、TradingViewが提供または承認する金融、投資、取引、またはその他の種類の助言もしくは推奨であることを意図したものではなく、またこれらに該当するものでもありません。詳細は利用規約をご覧ください。