
Lets start off with taking a look back at this chart from October 2019:
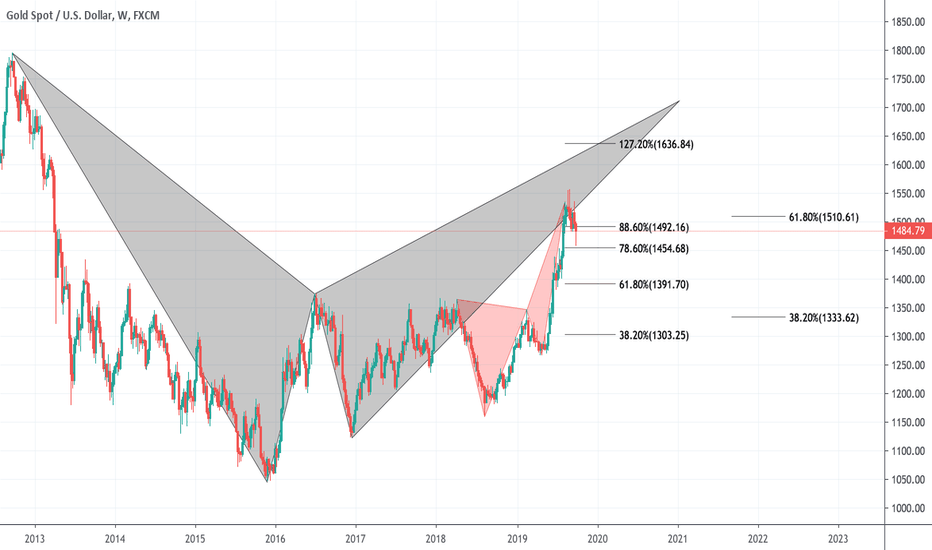
Heres how the weekly chart currenty looks:

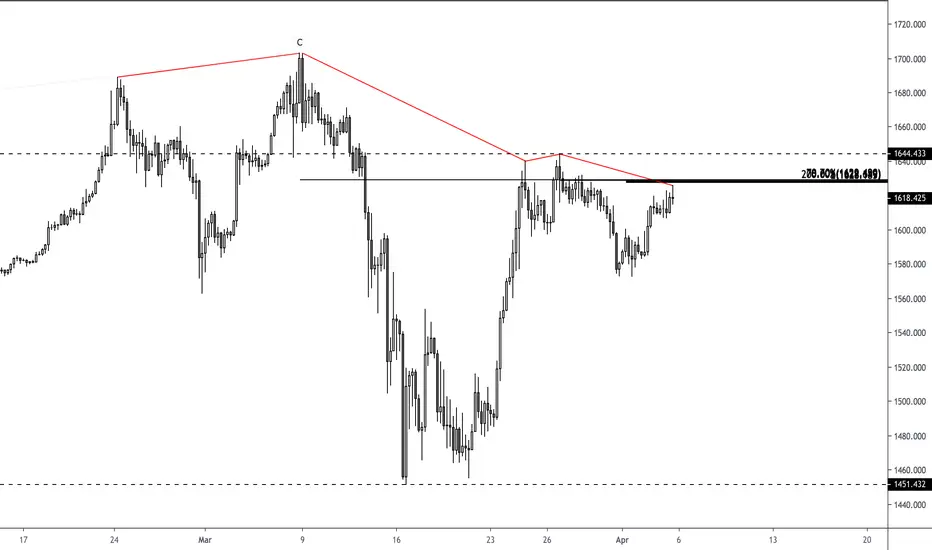
On the 4h timeframe red trendlines highlights both regular and hidden divergences appearing all over this market. ''C'' is a 261.8% extension that was followed by a 15% decline! Considering the huge drop, im expecting this trend to continue and another dip in this market is anticipated.
A trade with stops above the highs targeting the lows would not be a bad idea IMO.
Whats your view on XAU/USD?
Share your comments in the section below
Thank you for reading
Heres how the weekly chart currenty looks:
On the 4h timeframe red trendlines highlights both regular and hidden divergences appearing all over this market. ''C'' is a 261.8% extension that was followed by a 15% decline! Considering the huge drop, im expecting this trend to continue and another dip in this market is anticipated.
A trade with stops above the highs targeting the lows would not be a bad idea IMO.
Whats your view on XAU/USD?
Share your comments in the section below
Thank you for reading
ノート
A break below the trendline indicates a shift in momentum:
免責事項
これらの情報および投稿は、TradingViewが提供または承認する金融、投資、取引、またはその他の種類の助言もしくは推奨であることを意図したものではなく、またこれらに該当するものでもありません。詳細は利用規約をご覧ください。
免責事項
これらの情報および投稿は、TradingViewが提供または承認する金融、投資、取引、またはその他の種類の助言もしくは推奨であることを意図したものではなく、またこれらに該当するものでもありません。詳細は利用規約をご覧ください。