
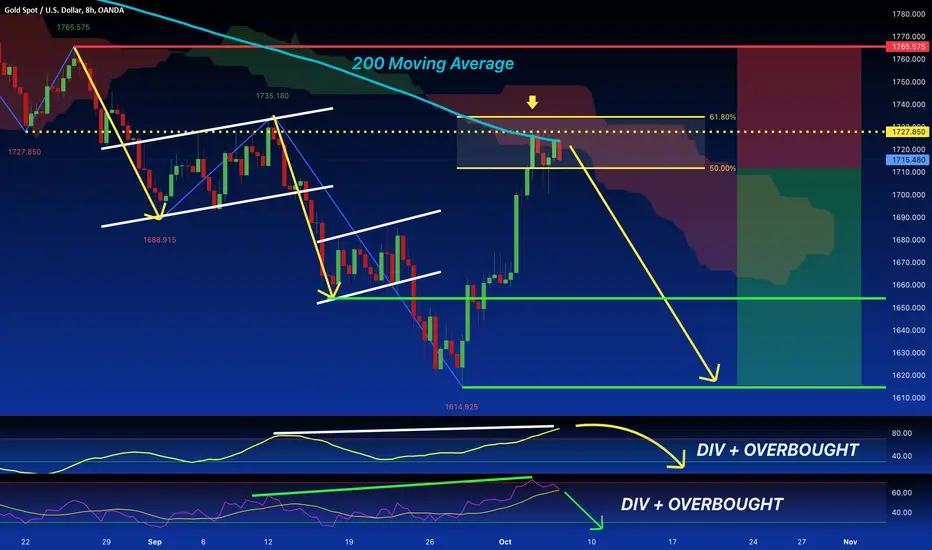
1727.85 is The resistance Area where the price for GOLD seems to find its turning point to come back in the direction of the primary trend, the Downtrend. In this Area, inside the 50% and 61.8% Fibonacci Levels the price does not go over the already talked about static resistance but also for the presence of the 200 Moving average. Both the RSI and Stochastic present a Divergence and also an Overbought Value. The Ichimoku remains Bearish and all these clues talk about a new Push down by the price.
ノート
✅ Our previous Idea ✅ Price react on the Resistance Level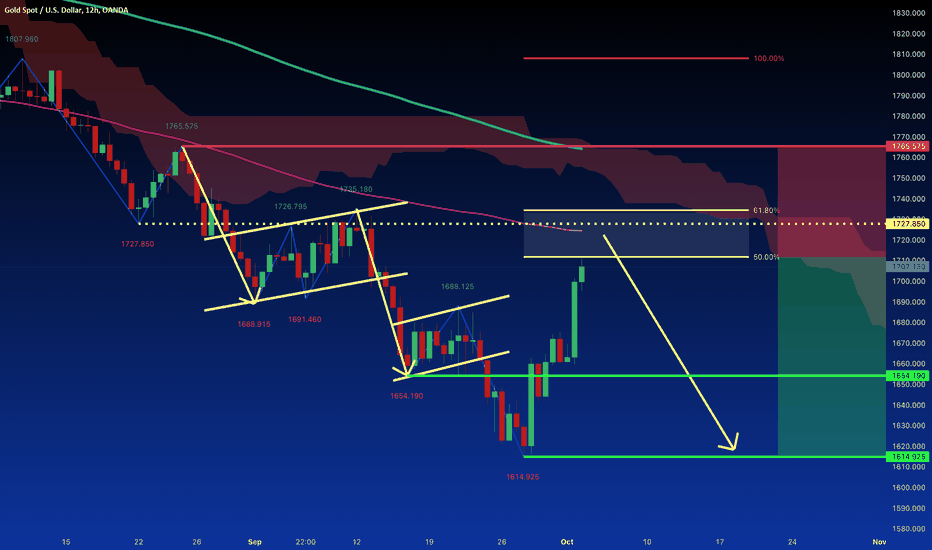
ノート
✅ TODAY ✅ 
関連の投稿
免責事項
これらの情報および投稿は、TradingViewが提供または承認する金融、投資、取引、またはその他の種類の助言もしくは推奨であることを意図したものではなく、またこれらに該当するものでもありません。詳細は利用規約をご覧ください。
関連の投稿
免責事項
これらの情報および投稿は、TradingViewが提供または承認する金融、投資、取引、またはその他の種類の助言もしくは推奨であることを意図したものではなく、またこれらに該当するものでもありません。詳細は利用規約をご覧ください。