
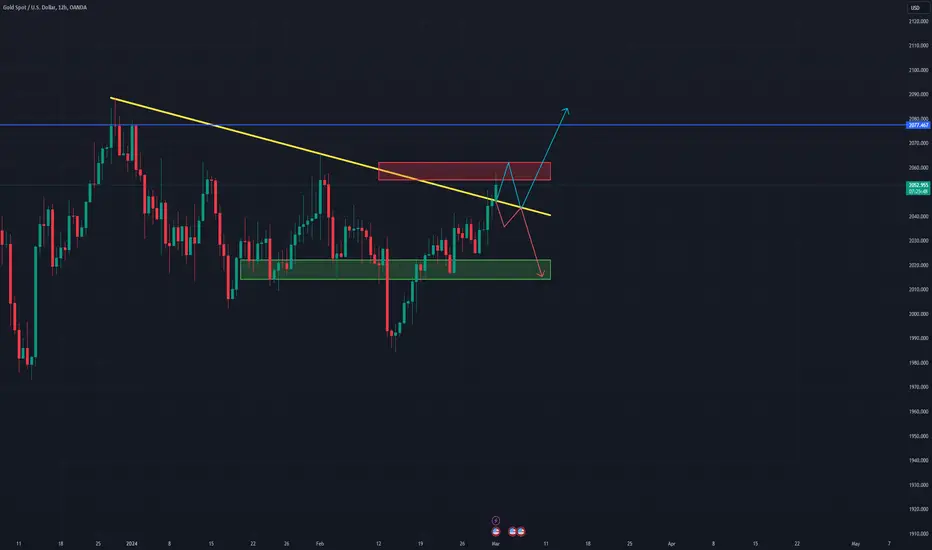
Gold has been in a long-term downtrend on the 12-hour timeframe and has been attempting to break this trendline for almost 2 days now.
Should it break the trendline, it faces a significant resistance range
2055 - 2062
We expect a reaction to this resistance after breaking the trendline, with a potential pullback to the broken trendline followed by its own upward move towards 2070.
In case it fails to break the downtrend line, we may witness a downward movement towards a key support range at 2020.
Should it break the trendline, it faces a significant resistance range
2055 - 2062
We expect a reaction to this resistance after breaking the trendline, with a potential pullback to the broken trendline followed by its own upward move towards 2070.
In case it fails to break the downtrend line, we may witness a downward movement towards a key support range at 2020.
ノート
Very exciting and swift 🌟 Our target for gold 2077 has been hit!
関連の投稿
免責事項
これらの情報および投稿は、TradingViewが提供または承認する金融、投資、取引、またはその他の種類の助言もしくは推奨であることを意図したものではなく、またこれらに該当するものでもありません。詳細は利用規約をご覧ください。
関連の投稿
免責事項
これらの情報および投稿は、TradingViewが提供または承認する金融、投資、取引、またはその他の種類の助言もしくは推奨であることを意図したものではなく、またこれらに該当するものでもありません。詳細は利用規約をご覧ください。