
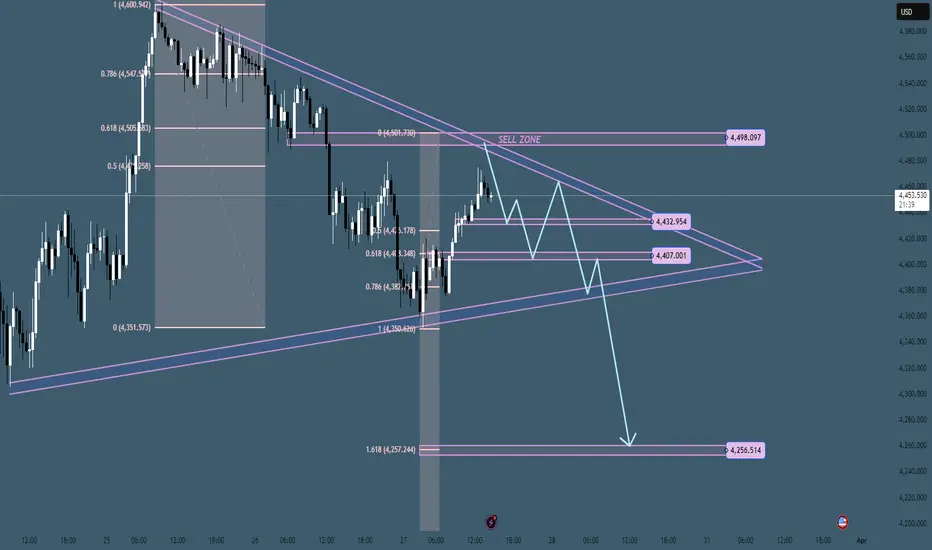
Gold is currently trading within a tight compression structure, forming a confluence between a descending trendline resistance and an ascending support trendline. This type of price action typically precedes a high-volatility breakout phase, especially after a strong prior move.
📉 Technical Structure
Following the previous impulsive drop, price has entered a corrective consolidation, forming a triangle-like structure. The recent rebound from the 4,350 base shows short-term buyer activity, but the overall structure still respects the downtrend channel.
The key highlight here is the Sell Zone around 4,498, which aligns with:
Descending trendline resistance
Previous supply area
Fibonacci retracement zone
This creates a high-probability reaction area.
📍 Key Levels
Sell Zone: 4,480 – 4,500
→ Confluence resistance / trendline rejection area
Mid Support: 4,430 – 4,400
→ Short-term reaction zone inside structure
Major Support: 4,350
→ Structural base
Bearish Target: 4,256 (1.618 extension)
→ Liquidity objective if breakdown confirms
⚖️ Market Context
Despite the recent recovery attempts, gold remains under pressure within a broader bearish structure. The current move appears to be a corrective pullback, filling inefficiencies before a potential continuation.
This type of compression often leads to:
👉 Fake breakout → liquidity grab
👉 Strong move in the opposite direction
🔍 Scenarios to Watch
Bearish Scenario (Preferred)
Rejection at 4,480 – 4,500
Break below ascending support
Acceleration toward 4,350 → 4,256
Bullish Scenario
Clean breakout above 4,500
Hold above resistance
Opens upside toward higher imbalance zones
✨ Conclusion
Gold is approaching a decision zone where structure, trendline, and liquidity converge.
This is not a market to chase —
👉 Wait for confirmation at key levels.
Compression leads to expansion — the only question is direction.
📉 Technical Structure
Following the previous impulsive drop, price has entered a corrective consolidation, forming a triangle-like structure. The recent rebound from the 4,350 base shows short-term buyer activity, but the overall structure still respects the downtrend channel.
The key highlight here is the Sell Zone around 4,498, which aligns with:
Descending trendline resistance
Previous supply area
Fibonacci retracement zone
This creates a high-probability reaction area.
📍 Key Levels
Sell Zone: 4,480 – 4,500
→ Confluence resistance / trendline rejection area
Mid Support: 4,430 – 4,400
→ Short-term reaction zone inside structure
Major Support: 4,350
→ Structural base
Bearish Target: 4,256 (1.618 extension)
→ Liquidity objective if breakdown confirms
⚖️ Market Context
Despite the recent recovery attempts, gold remains under pressure within a broader bearish structure. The current move appears to be a corrective pullback, filling inefficiencies before a potential continuation.
This type of compression often leads to:
👉 Fake breakout → liquidity grab
👉 Strong move in the opposite direction
🔍 Scenarios to Watch
Bearish Scenario (Preferred)
Rejection at 4,480 – 4,500
Break below ascending support
Acceleration toward 4,350 → 4,256
Bullish Scenario
Clean breakout above 4,500
Hold above resistance
Opens upside toward higher imbalance zones
✨ Conclusion
Gold is approaching a decision zone where structure, trendline, and liquidity converge.
This is not a market to chase —
👉 Wait for confirmation at key levels.
Compression leads to expansion — the only question is direction.

免責事項
これらの情報および投稿は、TradingViewが提供または承認する金融、投資、取引、またはその他の種類の助言もしくは推奨であることを意図したものではなく、またこれらに該当するものでもありません。詳細は利用規約をご覧ください。
免責事項
これらの情報および投稿は、TradingViewが提供または承認する金融、投資、取引、またはその他の種類の助言もしくは推奨であることを意図したものではなく、またこれらに該当するものでもありません。詳細は利用規約をご覧ください。