
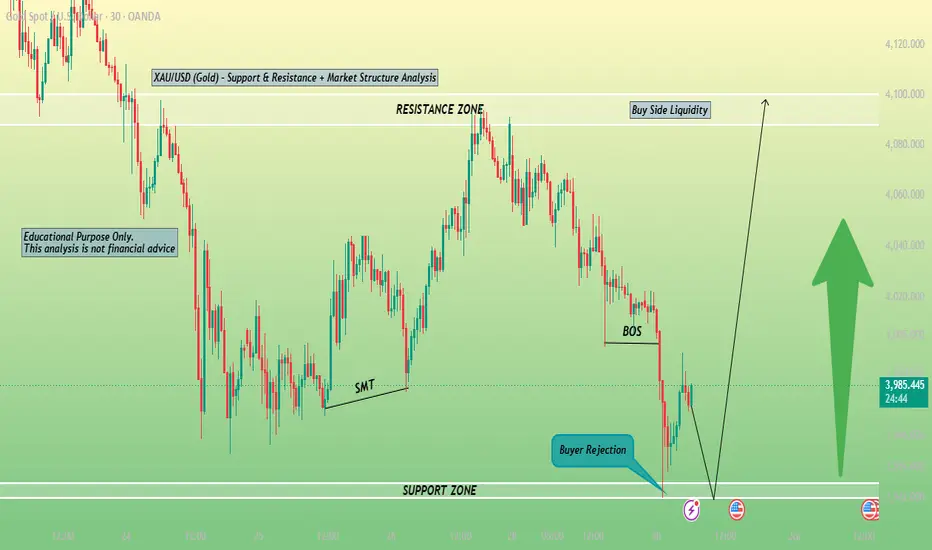
This chart presents an educational technical analysis of the XAU/USD (Gold) market on the 30-minute timeframe. It highlights key Support and Resistance Zones, allowing traders to identify areas where price has historically reacted. The analysis also demonstrates market structure, price movement, and potential reversal or continuation zones based on price action.
The resistance zone marks an area where selling pressure may increase, while the support zone indicates a potential buying interest where price could find stability. Traders should wait for proper confirmation, such as candlestick patterns or market structure breaks, before considering any trading decision.
This chart is created solely for educational and learning purposes to help traders understand support and resistance concepts, market behavior, and price action analysis. It should not be considered financial or investment advice. Always apply proper risk management and confirm your analysis before entering any trade.
The resistance zone marks an area where selling pressure may increase, while the support zone indicates a potential buying interest where price could find stability. Traders should wait for proper confirmation, such as candlestick patterns or market structure breaks, before considering any trading decision.
This chart is created solely for educational and learning purposes to help traders understand support and resistance concepts, market behavior, and price action analysis. It should not be considered financial or investment advice. Always apply proper risk management and confirm your analysis before entering any trade.
トレード稼働中
800 pips runingトレード終了: 利益確定目標に到達
1200 PIPS TARGET REACHED 
免責事項
これらの情報および投稿は、TradingViewが提供または承認する金融、投資、取引、またはその他の種類の助言もしくは推奨であることを意図したものではなく、またこれらに該当するものでもありません。詳細は利用規約をご覧ください。
免責事項
これらの情報および投稿は、TradingViewが提供または承認する金融、投資、取引、またはその他の種類の助言もしくは推奨であることを意図したものではなく、またこれらに該当するものでもありません。詳細は利用規約をご覧ください。