
Key Observations:
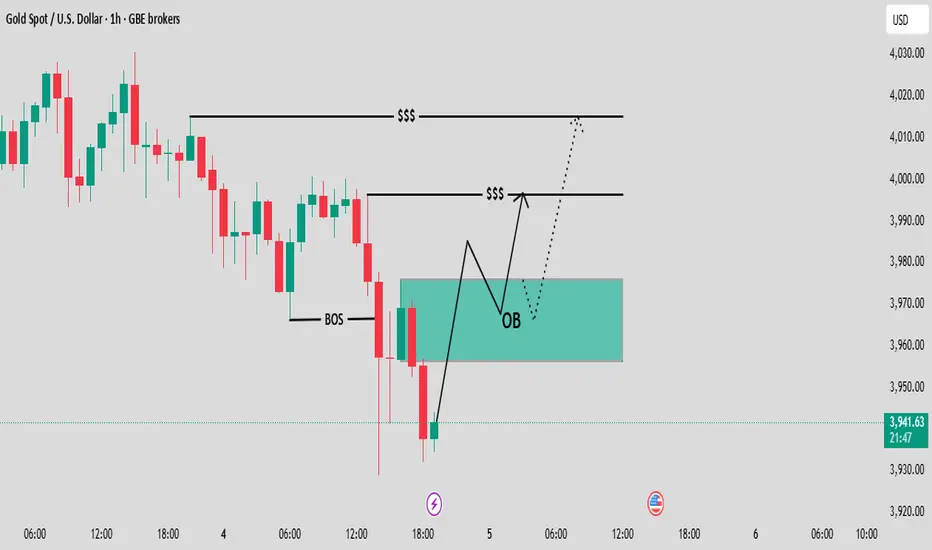
Break of Structure (BOS): Price has recently broken below a previous low, labeled BOS (Break of Structure). This indicates a shift to a bearish market structure in the short term, often leading traders to look for a retracement before a continuation of the downtrend.
Order Block (OB): A crucial area is highlighted and labeled OB (Order Block). This is a zone where significant institutional selling or buying pressure is believed to have entered the market previously. In this context, the OB is a potential resistance/supply zone that the price may retest.
Liquidity ($$$): Two levels above the current price are marked with $$$. These represent liquidity pools, which are areas where stop-loss orders from short sellers or buy-stop orders from breakout traders are likely resting. Institutional traders often target these zones to fuel their own trades.
The first $$$ (around 3,990) is an immediate target or a minor swing high.
The second $$$ (around 4,010-4,015) is a higher target, representing a more significant swing high.
Proposed Trade Scenario: The solid black line and the dotted arrow show the projected price path:
A retracement (pullback) into the Order Block (OB) zone (around 3,960 - 3,975).
A reversal within or near the OB, leading to a rally (buy/long).
The price targets are the liquidity ($$$) levels.
Current Price Action: The price is currently around 3,937.83, which is below the main Order Block, suggesting the price has already reacted to the BOS and is deep into a decline. The anticipated setup is a counter-trend move (a bullish reaction after a bearish move) or a re-accumulation phase before a larger move.
Break of Structure (BOS): Price has recently broken below a previous low, labeled BOS (Break of Structure). This indicates a shift to a bearish market structure in the short term, often leading traders to look for a retracement before a continuation of the downtrend.
Order Block (OB): A crucial area is highlighted and labeled OB (Order Block). This is a zone where significant institutional selling or buying pressure is believed to have entered the market previously. In this context, the OB is a potential resistance/supply zone that the price may retest.
Liquidity ($$$): Two levels above the current price are marked with $$$. These represent liquidity pools, which are areas where stop-loss orders from short sellers or buy-stop orders from breakout traders are likely resting. Institutional traders often target these zones to fuel their own trades.
The first $$$ (around 3,990) is an immediate target or a minor swing high.
The second $$$ (around 4,010-4,015) is a higher target, representing a more significant swing high.
Proposed Trade Scenario: The solid black line and the dotted arrow show the projected price path:
A retracement (pullback) into the Order Block (OB) zone (around 3,960 - 3,975).
A reversal within or near the OB, leading to a rally (buy/long).
The price targets are the liquidity ($$$) levels.
Current Price Action: The price is currently around 3,937.83, which is below the main Order Block, suggesting the price has already reacted to the BOS and is deep into a decline. The anticipated setup is a counter-trend move (a bullish reaction after a bearish move) or a re-accumulation phase before a larger move.

📊 Professional Forex & Gold Analyst | Trading pure price action and high-probability market structure. Daily 4–5 quality trade setups with disciplined risk management. Join: t.me/+NJDp2aIM3QphYWNk| Contact: @fx_martin9
免責事項
これらの情報および投稿は、TradingViewが提供または承認する金融、投資、取引、またはその他の種類の助言もしくは推奨であることを意図したものではなく、またこれらに該当するものでもありません。詳細は利用規約をご覧ください。
📊 Professional Forex & Gold Analyst | Trading pure price action and high-probability market structure. Daily 4–5 quality trade setups with disciplined risk management. Join: t.me/+NJDp2aIM3QphYWNk| Contact: @fx_martin9
免責事項
これらの情報および投稿は、TradingViewが提供または承認する金融、投資、取引、またはその他の種類の助言もしくは推奨であることを意図したものではなく、またこれらに該当するものでもありません。詳細は利用規約をご覧ください。