
Hello Goldie’s,
Welcome to another weekly update for the precious metal.
Gold remains in a long-term uptrend but is undergoing a meaningful pullback after topping near $4,770 earlier in May. Over the past month, gold has fallen ~3.86%, though it remains 34.51% higher year-on-year. The weekly structure shows lower highs forming — a warning sign. The $4,360–4,376 zone is the critical weekly support to hold. Losing it opens the door to $4,308 and below.
On the daily and 4H timeframes, price is consolidating beneath key resistance at 4,500–4,528. Momentum is slowly recovering, but confirmation is still needed for bullish continuation.
Key levels:
* Resistance: 4,528 / 4,580 / 4,640
* Support: 4,452 / 4,376 / 4,308
Bullish scenario: A breakout and close above 4,528 could open the path toward 4,580 and higher.
Bearish scenario: Failure to hold 4,452 may trigger another drop into the 4,376 demand zone before buyers return.
Overall bias:
* Weekly: Bullish
* Daily: Neutral-Bullish
* 4H: Consolidation
* 1H: Intraday recovery attempt
Lets deep dive :
Weekly Bias: Bearish/Corrective
Key support: $4,360 | Key resistance: $4,640–4,680
Gold remains in a broader bullish structure despite the recent correction from highs near 4,700. Price is still respecting the long-term ascending trend channel, but momentum has slowed significantly after rejection from the upper supply zone around 4,640–4,660.
Key observations:
* Weekly structure remains bullish above 4,308–4,360 demand.
* Current consolidation suggests distribution inside a corrective phase.
* As long as price holds above 4,360, buyers still control the macro trend.
* A reclaim above 4,528 and especially 4,580 would likely restart bullish continuation toward previous highs.
Bias:
* Medium-term bullish
* Short-term corrective/consolidative
Daily Bias: Bearish
Resistance: $4,528–4,580 | Support: $4,452 → $4,376
Daily price action shows gold trading inside a descending channel after failing to sustain above major resistance.
Important levels:
* Resistance: 4,500 → 4,528 → 4,580
* Support: 4,452 → 4,376 → 4,308
What the chart suggests:
* Price is compressing under resistance around 4,500.
* Daily candles show indecision and weak follow-through from sellers.
* Momentum indicators are stabilizing after oversold conditions.
* A sweep into 4,376–4,360 demand remains possible before a stronger rebound.
Scenarios:
1. Bullish:
* Hold above 4,452
* Break and close above 4,528
* Target 4,580 then 4,640
1. Bearish:
* Lose 4,452 decisively
* Retest 4,376 demand
* Possible extension toward 4,309
4H Bias: Bearish, watching for reversal
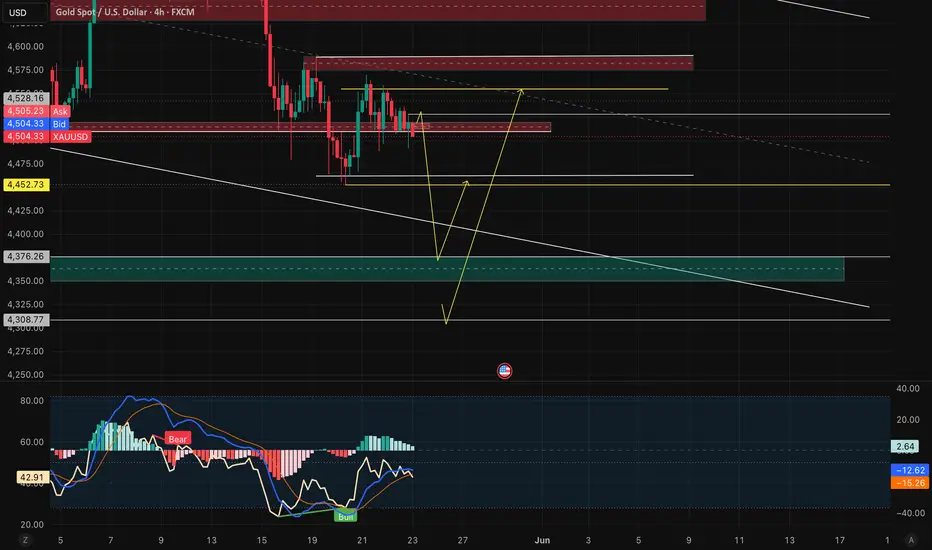
Resistance: $4,504–4,528 | Support: $4,452 → $4,376
The 4H chart is currently range-bound within a descending structure.
Current structure:
* Lower highs continue to respect descending trend-line resistance.
* Buyers are defending 4,452 support repeatedly.
* MACD momentum is improving slightly, hinting at possible short-term recovery.
Trade setup ideas:
* Bullish breakout above 4,528 could trigger momentum buying toward 4,560–4,580.
* Failure at resistance may send price back into liquidity zones around 4,376.
Market condition:
* Neutral to slightly bullish intraday
* Awaiting breakout confirmation
1H Bias: Bearish
Sell zone: $4,504–4,528 | Target: $4,452 → $4,376 | Invalidation: $4,530+
On the 1H chart, price action suggests accumulation near support after a sharp selloff.
Signals:
* Momentum divergence forming.
* Lower timeframe recovery attempts visible.
* Buyers stepping in around 4,480–4,452.
Intraday levels:
* Immediate resistance: 4,505 → 4,528
* Immediate support: 4,480 → 4,452
Intraday outlook:
* Above 4,500 favors upside continuation.
* Rejection below 4,500 increases probability of another liquidity sweep lower first.
Patience is key — wait for confirmation, not prediction. 📊
Welcome to another weekly update for the precious metal.
Gold remains in a long-term uptrend but is undergoing a meaningful pullback after topping near $4,770 earlier in May. Over the past month, gold has fallen ~3.86%, though it remains 34.51% higher year-on-year. The weekly structure shows lower highs forming — a warning sign. The $4,360–4,376 zone is the critical weekly support to hold. Losing it opens the door to $4,308 and below.
On the daily and 4H timeframes, price is consolidating beneath key resistance at 4,500–4,528. Momentum is slowly recovering, but confirmation is still needed for bullish continuation.
Key levels:
* Resistance: 4,528 / 4,580 / 4,640
* Support: 4,452 / 4,376 / 4,308
Bullish scenario: A breakout and close above 4,528 could open the path toward 4,580 and higher.
Bearish scenario: Failure to hold 4,452 may trigger another drop into the 4,376 demand zone before buyers return.
Overall bias:
* Weekly: Bullish
* Daily: Neutral-Bullish
* 4H: Consolidation
* 1H: Intraday recovery attempt
Lets deep dive :
Weekly Bias: Bearish/Corrective
Key support: $4,360 | Key resistance: $4,640–4,680
Gold remains in a broader bullish structure despite the recent correction from highs near 4,700. Price is still respecting the long-term ascending trend channel, but momentum has slowed significantly after rejection from the upper supply zone around 4,640–4,660.
Key observations:
* Weekly structure remains bullish above 4,308–4,360 demand.
* Current consolidation suggests distribution inside a corrective phase.
* As long as price holds above 4,360, buyers still control the macro trend.
* A reclaim above 4,528 and especially 4,580 would likely restart bullish continuation toward previous highs.
Bias:
* Medium-term bullish
* Short-term corrective/consolidative
Daily Bias: Bearish
Resistance: $4,528–4,580 | Support: $4,452 → $4,376
Daily price action shows gold trading inside a descending channel after failing to sustain above major resistance.
Important levels:
* Resistance: 4,500 → 4,528 → 4,580
* Support: 4,452 → 4,376 → 4,308
What the chart suggests:
* Price is compressing under resistance around 4,500.
* Daily candles show indecision and weak follow-through from sellers.
* Momentum indicators are stabilizing after oversold conditions.
* A sweep into 4,376–4,360 demand remains possible before a stronger rebound.
Scenarios:
1. Bullish:
* Hold above 4,452
* Break and close above 4,528
* Target 4,580 then 4,640
1. Bearish:
* Lose 4,452 decisively
* Retest 4,376 demand
* Possible extension toward 4,309
4H Bias: Bearish, watching for reversal
Resistance: $4,504–4,528 | Support: $4,452 → $4,376
The 4H chart is currently range-bound within a descending structure.
Current structure:
* Lower highs continue to respect descending trend-line resistance.
* Buyers are defending 4,452 support repeatedly.
* MACD momentum is improving slightly, hinting at possible short-term recovery.
Trade setup ideas:
* Bullish breakout above 4,528 could trigger momentum buying toward 4,560–4,580.
* Failure at resistance may send price back into liquidity zones around 4,376.
Market condition:
* Neutral to slightly bullish intraday
* Awaiting breakout confirmation
1H Bias: Bearish
Sell zone: $4,504–4,528 | Target: $4,452 → $4,376 | Invalidation: $4,530+
On the 1H chart, price action suggests accumulation near support after a sharp selloff.
Signals:
* Momentum divergence forming.
* Lower timeframe recovery attempts visible.
* Buyers stepping in around 4,480–4,452.
Intraday levels:
* Immediate resistance: 4,505 → 4,528
* Immediate support: 4,480 → 4,452
Intraday outlook:
* Above 4,500 favors upside continuation.
* Rejection below 4,500 increases probability of another liquidity sweep lower first.
Patience is key — wait for confirmation, not prediction. 📊

免責事項
これらの情報および投稿は、TradingViewが提供または承認する金融、投資、取引、またはその他の種類の助言もしくは推奨であることを意図したものではなく、またこれらに該当するものでもありません。詳細は利用規約をご覧ください。
免責事項
これらの情報および投稿は、TradingViewが提供または承認する金融、投資、取引、またはその他の種類の助言もしくは推奨であることを意図したものではなく、またこれらに該当するものでもありません。詳細は利用規約をご覧ください。