
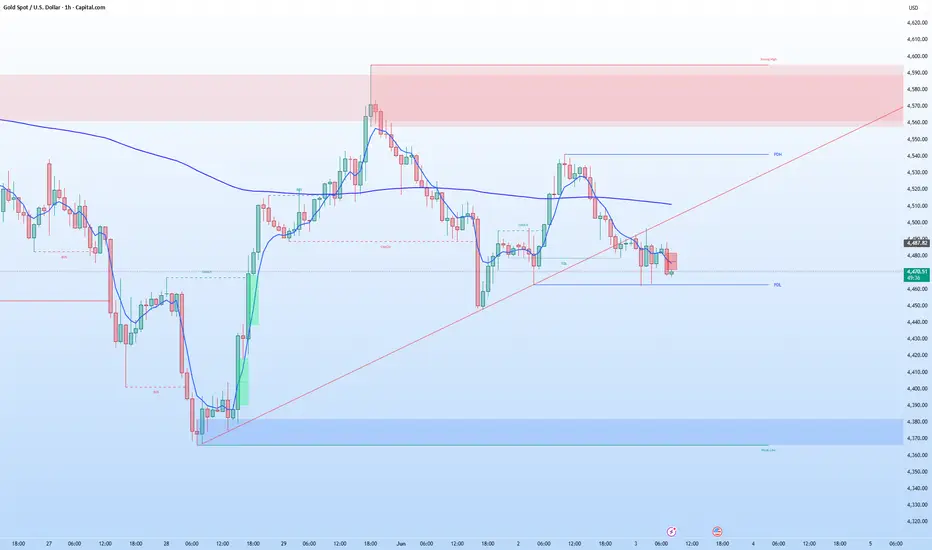
From the H1 structure, the market still looks short-term bearish and there is no real bullish reversal confirmation yet.
What stands out clearly:
price lost the ascending trendline
bearish BOS has already been confirmed
the 4540–4556 reaction zone was rejected aggressively
the red EMA is still pressing above price
every bullish impulse is becoming weaker
current structure resembles distribution/compression before another bearish continuation
Key levels:
4487–4490 = local resistance now
4507–4510 = short-term bearish invalidation
4462 = nearby liquidity target
4433 = first major reaction level
below 4433 the market could accelerate toward:
4400
4374
4325 major yearly zone
What I’m watching:
if price continues printing lower highs below 4490 → downside continuation remains favored
only a recovery and hold above 4507–4510 could shift momentum back bullish
For now:
the bias remains bearish-neutral with sellers still having the advantage.
What stands out clearly:
price lost the ascending trendline
bearish BOS has already been confirmed
the 4540–4556 reaction zone was rejected aggressively
the red EMA is still pressing above price
every bullish impulse is becoming weaker
current structure resembles distribution/compression before another bearish continuation
Key levels:
4487–4490 = local resistance now
4507–4510 = short-term bearish invalidation
4462 = nearby liquidity target
4433 = first major reaction level
below 4433 the market could accelerate toward:
4400
4374
4325 major yearly zone
What I’m watching:
if price continues printing lower highs below 4490 → downside continuation remains favored
only a recovery and hold above 4507–4510 could shift momentum back bullish
For now:
the bias remains bearish-neutral with sellers still having the advantage.
ノート

免責事項
これらの情報および投稿は、TradingViewが提供または承認する金融、投資、取引、またはその他の種類の助言もしくは推奨であることを意図したものではなく、またこれらに該当するものでもありません。詳細は利用規約をご覧ください。
免責事項
これらの情報および投稿は、TradingViewが提供または承認する金融、投資、取引、またはその他の種類の助言もしくは推奨であることを意図したものではなく、またこれらに該当するものでもありません。詳細は利用規約をご覧ください。