Gold's Consolidation Continues with Limited Momentum
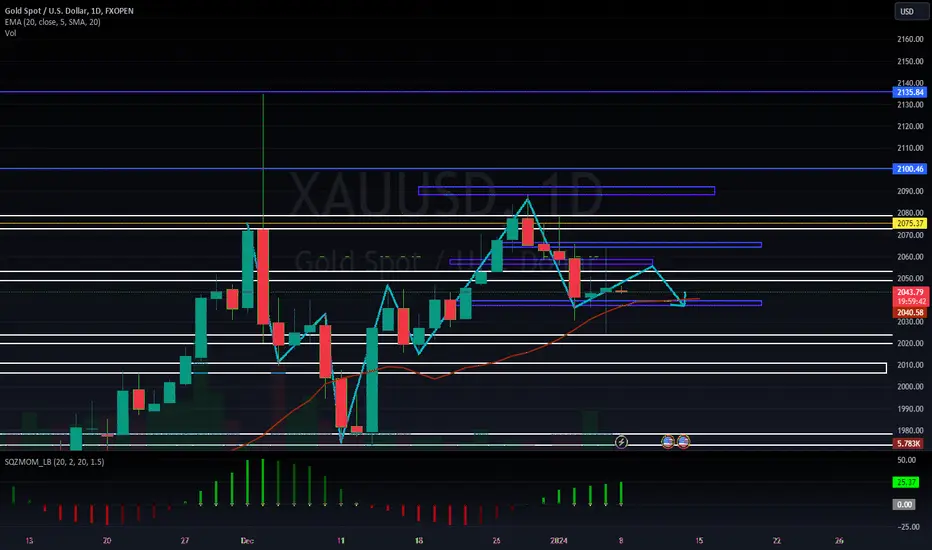
The daily XAU/USD chart shows a slight uptick as it finds buyers around the 20-day Simple Moving Average (SMA) for the second consecutive day, indicating a lack of clear directional strength. The convergence of SMA 100 and 200 around $1,950 without a distinct slope suggests a stagnant market. Technical indicators remain neutral, with the RSI moving sideways and Momentum showing a slight downward trend. Overall, the potential for a price decline seems constrained as long as the precious metal holds its ground near $2,030.
In the short term, the 4-hour chart depicts a neutral stance. XAU/USD trades below the declining SMA 20 but above the sideways-moving SMA 100. Technical indicators remain in negative territory but display a slight upward turn, hinting at a potential advantage for buyers.
Support Levels: $2,031.00, $2,015.50, $1,998.65
Resistance Levels: $2,040.20, $2,052.30, $2,065.45
In the short term, the 4-hour chart depicts a neutral stance. XAU/USD trades below the declining SMA 20 but above the sideways-moving SMA 100. Technical indicators remain in negative territory but display a slight upward turn, hinting at a potential advantage for buyers.
Support Levels: $2,031.00, $2,015.50, $1,998.65
Resistance Levels: $2,040.20, $2,052.30, $2,065.45

関連の投稿
免責事項
これらの情報および投稿は、TradingViewが提供または承認する金融、投資、取引、またはその他の種類の助言もしくは推奨であることを意図したものではなく、またこれらに該当するものでもありません。詳細は利用規約をご覧ください。
関連の投稿
免責事項
これらの情報および投稿は、TradingViewが提供または承認する金融、投資、取引、またはその他の種類の助言もしくは推奨であることを意図したものではなく、またこれらに該当するものでもありません。詳細は利用規約をご覧ください。