
Hello Everyone,
After reviewing the current structure on the Daily timeframe, the market is approaching a very important decision area.
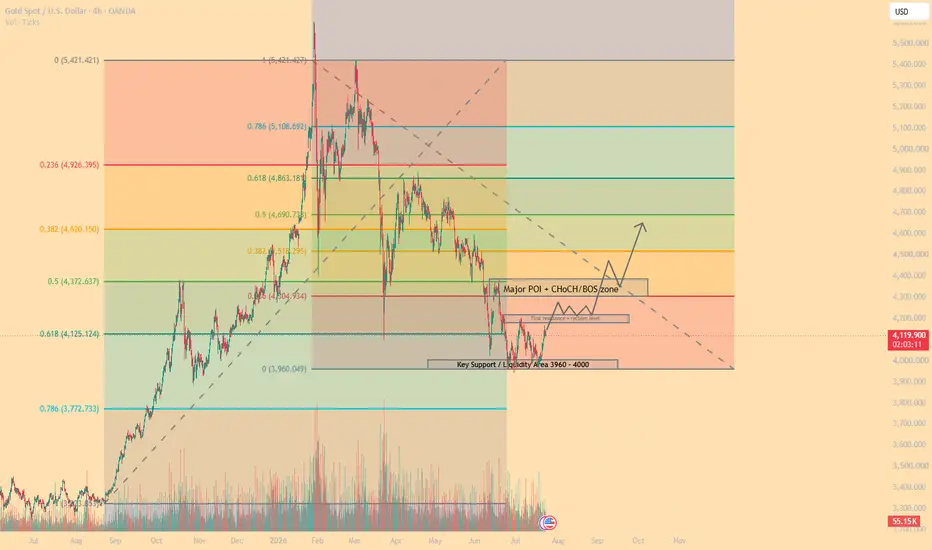
The recent low around 3960 is considered the main swing low, not because of a single wick, but because of the repeated reactions and multiple candle rejections from this area. This indicates strong demand and confirms that this zone is currently the key support level in the structure.
However, despite the reaction from this area, the overall structure remains bearish until price proves otherwise.
Key Resistance / POI Zone: 4304 – 4386
This area represents the most important decision zone for the next major move.
Why is this zone significant?
🔹 4304
Represents the first Fibonacci retracement level of the current bearish move.
Acts as the first structural obstacle for any bullish recovery.
🔹 4372
Represents the 0.5 Fibonacci retracement level of the previous bullish leg.
Also aligns with the last confirmed Lower High (LH) in the current bearish structure.
🔹 4386
Represents the liquidity above the previous lower high wick.
A daily close above this level would be a significant structural event.
Current Market Scenario
As long as price remains below the 4304 – 4386 resistance zone, the market is still respecting the bearish structure.
Any move higher before breaking this zone should be considered a retracement, not a confirmed reversal.
The bullish scenario requires a clear sequence:
✅ Break above the 4304 – 4386 zone
✅ Daily close above 4386
✅ Successful retest of the broken structure as support
✅ Formation of a Higher Low (HL)
✅ Creation of a new Higher High (HH)
Only after this confirmation can we consider that the bearish momentum is weakening and a potential bullish leg is developing.
Bearish Scenario
If price fails to break the resistance zone and gets rejected:
The move higher could simply be a liquidity grab or a corrective bounce.
Sellers may regain control.
The main support remains around 3960.
A break below 3960 would invalidate the bullish recovery idea and suggest continuation of the bearish structure.
Key Levels To Watch
🟢 Bullish Confirmation:
Daily close above 4386 + successful retest
🟡 Decision Zone:
4304 – 4386
🔴 Major Support / Invalidation Level:
3960
Conclusion
The market is currently at a critical point.
The reaction from 3960 shows strong demand, but a bottom is not confirmed yet. The next important step is not simply reaching higher prices, but breaking the last major Lower High and proving that buyers can create a new market structure.
The confirmation process remains:
Break → Retest → Higher Low → Higher High
Until this happens, the market remains inside a bearish structure with a potential reversal setup developing.
After reviewing the current structure on the Daily timeframe, the market is approaching a very important decision area.
The recent low around 3960 is considered the main swing low, not because of a single wick, but because of the repeated reactions and multiple candle rejections from this area. This indicates strong demand and confirms that this zone is currently the key support level in the structure.
However, despite the reaction from this area, the overall structure remains bearish until price proves otherwise.
Key Resistance / POI Zone: 4304 – 4386
This area represents the most important decision zone for the next major move.
Why is this zone significant?
🔹 4304
Represents the first Fibonacci retracement level of the current bearish move.
Acts as the first structural obstacle for any bullish recovery.
🔹 4372
Represents the 0.5 Fibonacci retracement level of the previous bullish leg.
Also aligns with the last confirmed Lower High (LH) in the current bearish structure.
🔹 4386
Represents the liquidity above the previous lower high wick.
A daily close above this level would be a significant structural event.
Current Market Scenario
As long as price remains below the 4304 – 4386 resistance zone, the market is still respecting the bearish structure.
Any move higher before breaking this zone should be considered a retracement, not a confirmed reversal.
The bullish scenario requires a clear sequence:
✅ Break above the 4304 – 4386 zone
✅ Daily close above 4386
✅ Successful retest of the broken structure as support
✅ Formation of a Higher Low (HL)
✅ Creation of a new Higher High (HH)
Only after this confirmation can we consider that the bearish momentum is weakening and a potential bullish leg is developing.
Bearish Scenario
If price fails to break the resistance zone and gets rejected:
The move higher could simply be a liquidity grab or a corrective bounce.
Sellers may regain control.
The main support remains around 3960.
A break below 3960 would invalidate the bullish recovery idea and suggest continuation of the bearish structure.
Key Levels To Watch
🟢 Bullish Confirmation:
Daily close above 4386 + successful retest
🟡 Decision Zone:
4304 – 4386
🔴 Major Support / Invalidation Level:
3960
Conclusion
The market is currently at a critical point.
The reaction from 3960 shows strong demand, but a bottom is not confirmed yet. The next important step is not simply reaching higher prices, but breaking the last major Lower High and proving that buyers can create a new market structure.
The confirmation process remains:
Break → Retest → Higher Low → Higher High
Until this happens, the market remains inside a bearish structure with a potential reversal setup developing.
トレード稼働中

免責事項
これらの情報および投稿は、TradingViewが提供または承認する金融、投資、取引、またはその他の種類の助言もしくは推奨であることを意図したものではなく、またこれらに該当するものでもありません。詳細は利用規約をご覧ください。
免責事項
これらの情報および投稿は、TradingViewが提供または承認する金融、投資、取引、またはその他の種類の助言もしくは推奨であることを意図したものではなく、またこれらに該当するものでもありません。詳細は利用規約をご覧ください。