
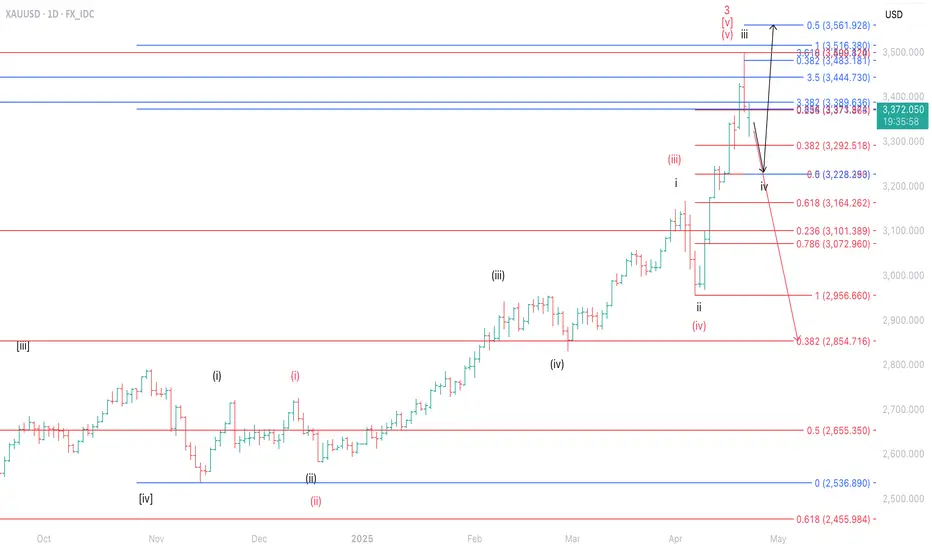
As I previously mentioned, the upside potential in XAUUSD appears relatively limited. At present, I estimate that XAUUSD is forming wave iv of wave (v) as indicated by the black label (best-case scenario), suggesting a potential correction toward the 3,228–3,292 range. Should this scenario hold, the next bullish target lies within the 3,483–3,561 area.
However, you should also be mindful of the bearish scenario (red label), where XAUUSD may have completed wave 3. In such a case, the current movement could represent the beginning of a deeper correction as part of wave 4, with the potential downside projected toward the 2,854–3,101 range.
However, you should also be mindful of the bearish scenario (red label), where XAUUSD may have completed wave 3. In such a case, the current movement could represent the beginning of a deeper correction as part of wave 4, with the potential downside projected toward the 2,854–3,101 range.

免責事項
これらの情報および投稿は、TradingViewが提供または承認する金融、投資、取引、またはその他の種類の助言もしくは推奨であることを意図したものではなく、またこれらに該当するものでもありません。詳細は利用規約をご覧ください。
免責事項
これらの情報および投稿は、TradingViewが提供または承認する金融、投資、取引、またはその他の種類の助言もしくは推奨であることを意図したものではなく、またこれらに該当するものでもありません。詳細は利用規約をご覧ください。