
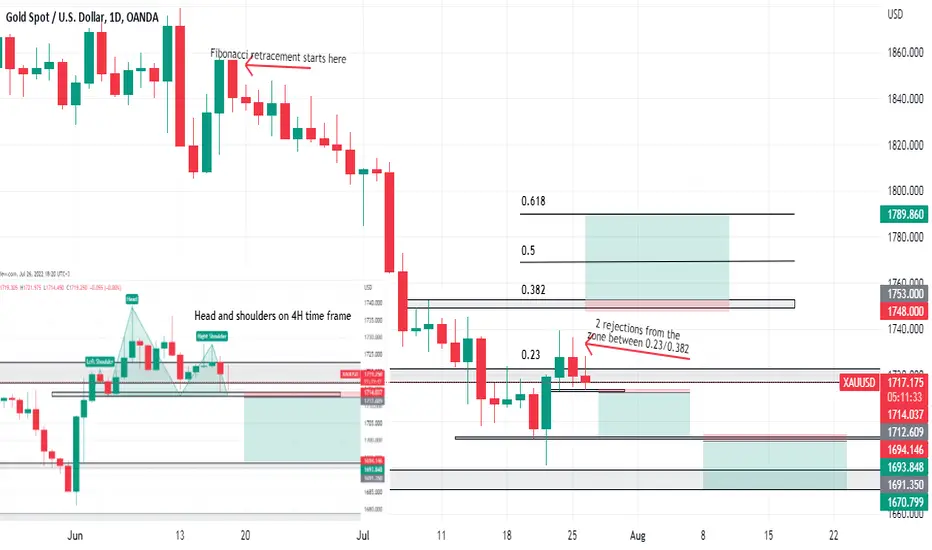
There is a high probability for a short position on gold based on:
1) Price action: Fibonacci retracement and price action indicate a rejection from the area between 0.23/0.382 fib levels. These levels also happen to be major support/resistance levels on the daily chart.
2) Head and shoulders pattern forming on the 4H chart as an additional confirmation
Keep in mind the possibility of a buy position if price breaks the previous resistance.
Set your stop losses according to your risk management strategy.
Leave your opinions in the comment, I will make sure to reply to them!!
1) Price action: Fibonacci retracement and price action indicate a rejection from the area between 0.23/0.382 fib levels. These levels also happen to be major support/resistance levels on the daily chart.
2) Head and shoulders pattern forming on the 4H chart as an additional confirmation
Keep in mind the possibility of a buy position if price breaks the previous resistance.
Set your stop losses according to your risk management strategy.
Leave your opinions in the comment, I will make sure to reply to them!!
トレード終了: 利益確定目標に到達
Update: The buy order hit the full target and more! then reversed from a resistance zone. Amazing trade!
免責事項
これらの情報および投稿は、TradingViewが提供または承認する金融、投資、取引、またはその他の種類の助言もしくは推奨であることを意図したものではなく、またこれらに該当するものでもありません。詳細は利用規約をご覧ください。
免責事項
これらの情報および投稿は、TradingViewが提供または承認する金融、投資、取引、またはその他の種類の助言もしくは推奨であることを意図したものではなく、またこれらに該当するものでもありません。詳細は利用規約をご覧ください。