
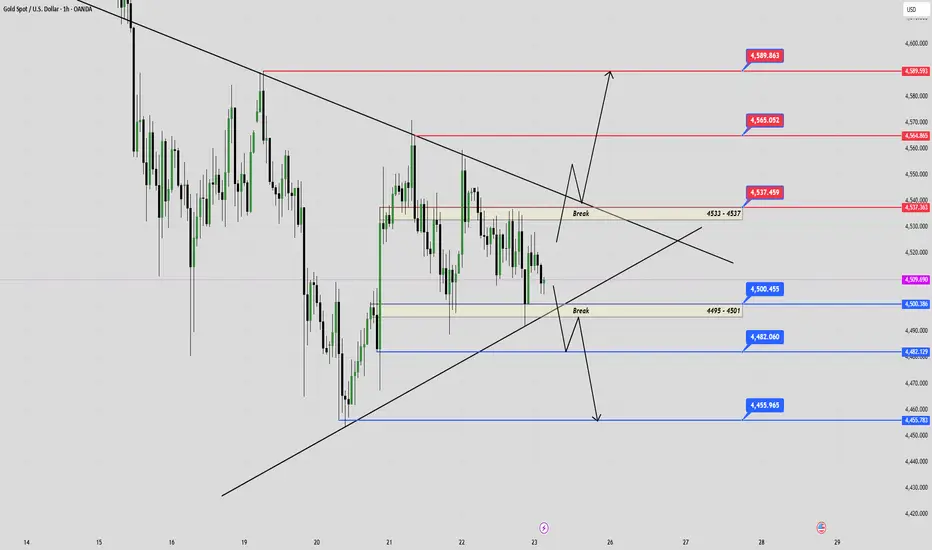
- XAUUSD/H1: Last week, the market fluctuated sideways, consolidating within the trendline channel and closing the weekly candle near the nearest support zone (4495 - 4501). The multi-timeframe EMA (H4 - H2 - H1) indicates that the current trend is still leaning towards a downtrend, with EMA34 below EMA89.
- The (4533 - 4537) zone is the nearest resistance zone and confluence of the downtrend line. If this zone is broken, the uptrend will resume. The (4495 - 4501) zone is a crucial support zone; if sellers break through this zone and the uptrend line, the downtrend will begin.
✅ VIEW
1. SELL SCENARIO:
- If gold shows a upward gap and recovers to the resistance zone (4533 - 4537), wait for a confirmation candle to break and close above this resistance zone (avoid false breakouts).
=> If the price breaks out falsely and closes below the resistance zone (4533 - 4537) while still respecting the downtrend line, prioritize finding a sell opportunity in line with the current downtrend.
= The target is to move back towards the sideways range of last week (451x - 450x).
= When the price breaks out and closes below the support zone (4495 - 4501) and simultaneously breaks the uptrend line, the downtrend will extend towards lower support levels (448x and 445x).
= The support zone (4453 - 4457) is the crucial area for determining how deeply the selling momentum extends.
2. BUY SCENARIO:
- A weekly candle closing above the near support zone (4495 - 4501) while still respecting the uptrend line indicates that buyers are still defending the price well.
- Along with positive US-Iran news at the end of the week, which is supporting a rise in gold prices, the upward momentum is controllable; just one negative piece of news could immediately push gold down.
=> If the market opens with an upward gap at the beginning of the week, wait for a candle on a larger timeframe to confirm the breakout and close above the resistance zone (4533 - 4537) and simultaneously break the downtrend line. Then, the short-term upward momentum will recover towards higher resistance levels (456x and 458x).
⚠️The market is likely to be impacted by news about the US-Iran conflict at the end of the week, showing positive signs of negotiations as both sides may reach a preliminary agreement... potentially creating an upward gap.
=>However, the current technical structure still leans towards a decline, with multi-timeframe EMAs all pointing downwards and the price still fluctuating below the downtrend line and key resistance zones. The price range (4533 - 4537) is a crucial zone; if it fails to break through the continuing strong downtrend, then a complete breakout would clearly confirm the return of buyers in the short term.
- The (4533 - 4537) zone is the nearest resistance zone and confluence of the downtrend line. If this zone is broken, the uptrend will resume. The (4495 - 4501) zone is a crucial support zone; if sellers break through this zone and the uptrend line, the downtrend will begin.
✅ VIEW
1. SELL SCENARIO:
- If gold shows a upward gap and recovers to the resistance zone (4533 - 4537), wait for a confirmation candle to break and close above this resistance zone (avoid false breakouts).
=> If the price breaks out falsely and closes below the resistance zone (4533 - 4537) while still respecting the downtrend line, prioritize finding a sell opportunity in line with the current downtrend.
= The target is to move back towards the sideways range of last week (451x - 450x).
= When the price breaks out and closes below the support zone (4495 - 4501) and simultaneously breaks the uptrend line, the downtrend will extend towards lower support levels (448x and 445x).
= The support zone (4453 - 4457) is the crucial area for determining how deeply the selling momentum extends.
2. BUY SCENARIO:
- A weekly candle closing above the near support zone (4495 - 4501) while still respecting the uptrend line indicates that buyers are still defending the price well.
- Along with positive US-Iran news at the end of the week, which is supporting a rise in gold prices, the upward momentum is controllable; just one negative piece of news could immediately push gold down.
=> If the market opens with an upward gap at the beginning of the week, wait for a candle on a larger timeframe to confirm the breakout and close above the resistance zone (4533 - 4537) and simultaneously break the downtrend line. Then, the short-term upward momentum will recover towards higher resistance levels (456x and 458x).
⚠️The market is likely to be impacted by news about the US-Iran conflict at the end of the week, showing positive signs of negotiations as both sides may reach a preliminary agreement... potentially creating an upward gap.
=>However, the current technical structure still leans towards a decline, with multi-timeframe EMAs all pointing downwards and the price still fluctuating below the downtrend line and key resistance zones. The price range (4533 - 4537) is a crucial zone; if it fails to break through the continuing strong downtrend, then a complete breakout would clearly confirm the return of buyers in the short term.

免責事項
これらの情報および投稿は、TradingViewが提供または承認する金融、投資、取引、またはその他の種類の助言もしくは推奨であることを意図したものではなく、またこれらに該当するものでもありません。詳細は利用規約をご覧ください。
免責事項
これらの情報および投稿は、TradingViewが提供または承認する金融、投資、取引、またはその他の種類の助言もしくは推奨であることを意図したものではなく、またこれらに該当するものでもありません。詳細は利用規約をご覧ください。