
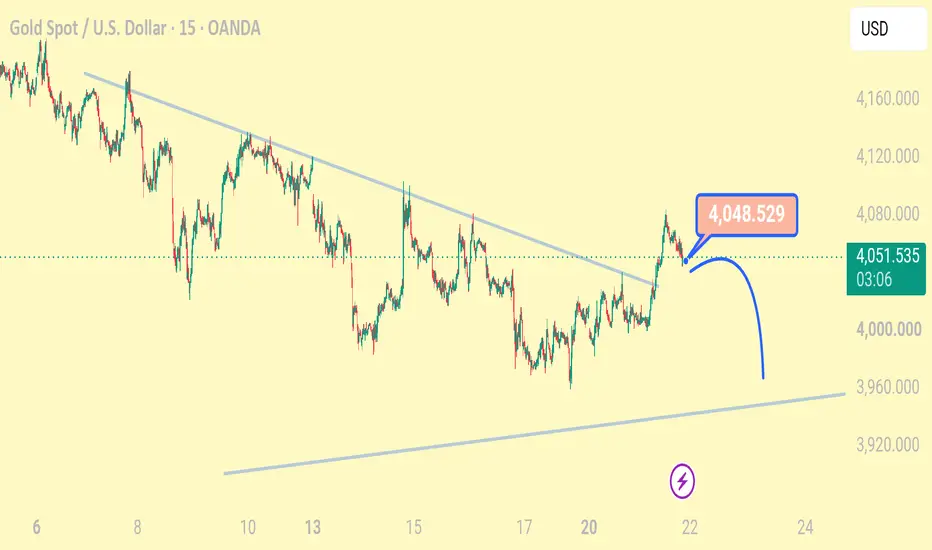
XAUUSD 15M Chart — Technical
Current Price: 4,050.445
Key Resistance: 4,048.529–4,050 area
Price is testing the upper descending trendline, which is acting as resistance.
The chart shows a symmetrical triangle / compression structure.
Bearish scenario: If price is rejected around 4,048–4,050, downside could target 4,000, followed by the lower trendline around 3,950.
Bullish scenario: A strong 15M candle close above the descending trendline could invalidate the immediate bearish setup and open the way for further upside.
Current Price: 4,050.445
Key Resistance: 4,048.529–4,050 area
Price is testing the upper descending trendline, which is acting as resistance.
The chart shows a symmetrical triangle / compression structure.
Bearish scenario: If price is rejected around 4,048–4,050, downside could target 4,000, followed by the lower trendline around 3,950.
Bullish scenario: A strong 15M candle close above the descending trendline could invalidate the immediate bearish setup and open the way for further upside.

免責事項
これらの情報および投稿は、TradingViewが提供または承認する金融、投資、取引、またはその他の種類の助言もしくは推奨であることを意図したものではなく、またこれらに該当するものでもありません。詳細は利用規約をご覧ください。
免責事項
これらの情報および投稿は、TradingViewが提供または承認する金融、投資、取引、またはその他の種類の助言もしくは推奨であることを意図したものではなく、またこれらに該当するものでもありません。詳細は利用規約をご覧ください。