
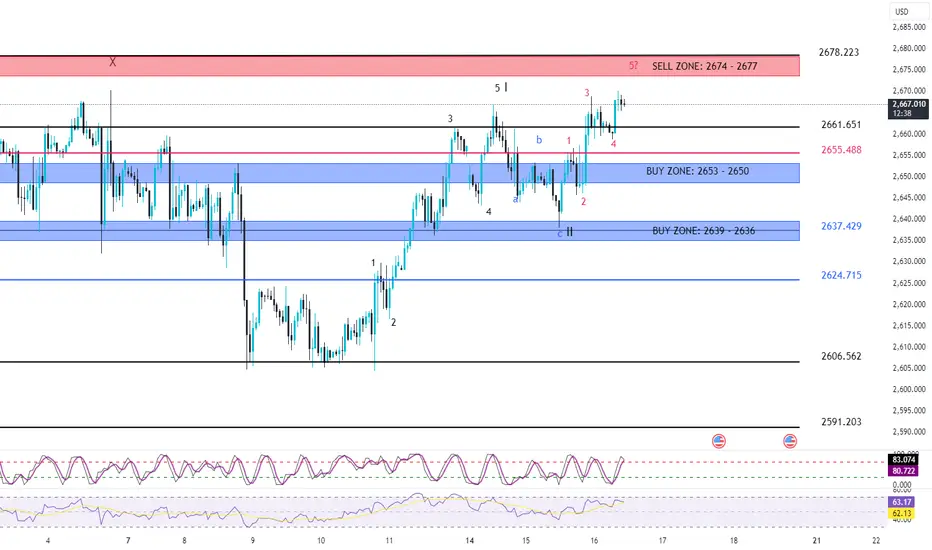
Looking at H1 we see that the price has completed a 5-wave structure and a 3-wave corrective structure, so in the larger wave structure we have that wave 1 and wave 2 have been completed
- In the current wave structure, after a 3-wave bearish structure there will be an uptrend
- Looking at the current price line we have a red 5-wave bullish structure forming
- Our problem is to determine the target of the red wave 5
- I measure the expected area of the red wave 5 is the price zone 2674 - 2677
- After completing the red 5-wave bullish wave there will be 3 corrective waves, the target area of this corrective wave is the zone 2653 - 2650
- In case the price breaks below this zone to approach the zone 2639 - 2636, this is the price zone where the recovery may not be as strong as the zone above
Trading plan
SELL ZONE: 2674 - 2677
SL: 2684
TP1: 2661
TP2: 2655
BUY ZONE: 2653 - 2650
SL: 2645
TP1: 2663
TP2: 2673
BUY ZONE: 2639 - 2636
SL: 2629
TP1: 2649
TP2: 2655

関連の投稿
免責事項
これらの情報および投稿は、TradingViewが提供または承認する金融、投資、取引、またはその他の種類の助言もしくは推奨であることを意図したものではなく、またこれらに該当するものでもありません。詳細は利用規約をご覧ください。
関連の投稿
免責事項
これらの情報および投稿は、TradingViewが提供または承認する金融、投資、取引、またはその他の種類の助言もしくは推奨であることを意図したものではなく、またこれらに該当するものでもありません。詳細は利用規約をご覧ください。