
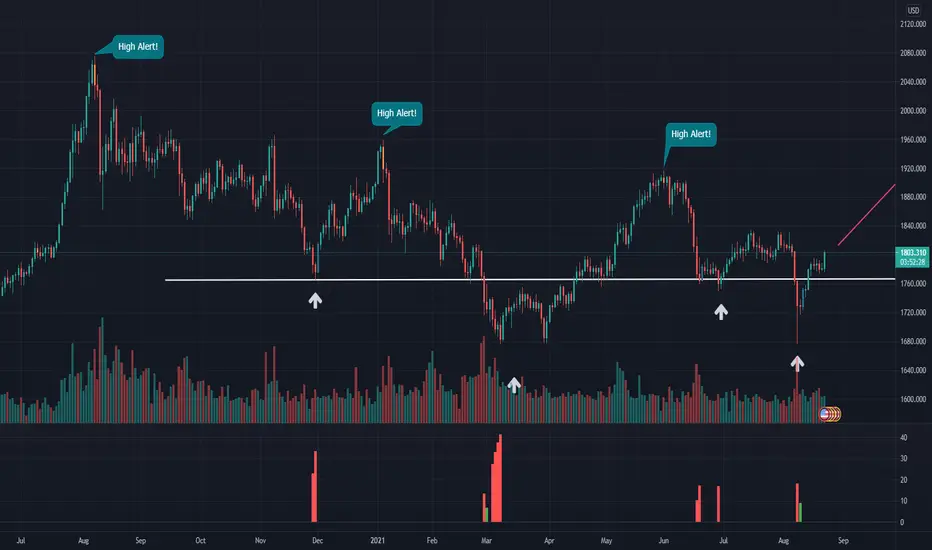
Short term analysis :
YELLOW CANDLE indicates short-term high point reversal signal. Sell after price fall below lowest price of the previous yellow candle.
Banker Chip Collection represents a series of buying activities when a stock fell a lot. Buy after price rises above the last BCC bar corresponding candle's highest price.
Disclaimer:
This is for tutorial purpose / case study only.
Please get advise from your broker for trading.
Thank you.
YELLOW CANDLE indicates short-term high point reversal signal. Sell after price fall below lowest price of the previous yellow candle.
Banker Chip Collection represents a series of buying activities when a stock fell a lot. Buy after price rises above the last BCC bar corresponding candle's highest price.
Disclaimer:
This is for tutorial purpose / case study only.
Please get advise from your broker for trading.
Thank you.

免責事項
これらの情報および投稿は、TradingViewが提供または承認する金融、投資、取引、またはその他の種類の助言もしくは推奨であることを意図したものではなく、またこれらに該当するものでもありません。詳細は利用規約をご覧ください。
免責事項
これらの情報および投稿は、TradingViewが提供または承認する金融、投資、取引、またはその他の種類の助言もしくは推奨であることを意図したものではなく、またこれらに該当するものでもありません。詳細は利用規約をご覧ください。