
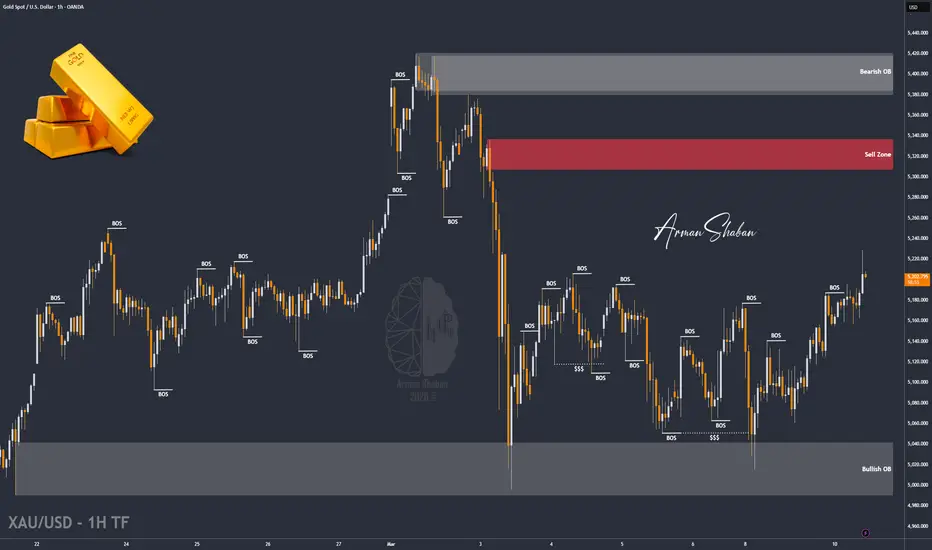
By analyzing the #Gold chart on the 1-hour timeframe, we can see that price reacted exactly as expected around the key levels discussed in the previous analysis.
Gold initially pushed higher and reached the $5150 supply zone, where we expected strong selling pressure to appear. From this level, the market reacted sharply and dropped more than 300 pips, falling from around $5155 down to $5124. After reaching this area, buying pressure stepped in once again and triggered another bullish expansion. Following this move, Gold rallied strongly and reached $5229, marking the highest level of the past 6 trading days.
After touching this level, the market entered a minor corrective phase and Gold is currently trading around the $5210 region. If price manages to hold and stabilize above the $5155 – $5185 zone, we may expect further bullish continuation from this structure. In that case, the short-term upside targets remain $5220, followed by $5230, and then $5260. If bullish momentum continues to build, the market could eventually push toward levels above $5300 in the next expansion phase.
As always, this chart will continue to be updated step by step as price reacts to the next important levels.
Please support me with your likes and comments to motivate me to share more analysis with you and share your opinion about the possible trend of this chart with me !
Best Regards , Arman Shaban
Gold initially pushed higher and reached the $5150 supply zone, where we expected strong selling pressure to appear. From this level, the market reacted sharply and dropped more than 300 pips, falling from around $5155 down to $5124. After reaching this area, buying pressure stepped in once again and triggered another bullish expansion. Following this move, Gold rallied strongly and reached $5229, marking the highest level of the past 6 trading days.
After touching this level, the market entered a minor corrective phase and Gold is currently trading around the $5210 region. If price manages to hold and stabilize above the $5155 – $5185 zone, we may expect further bullish continuation from this structure. In that case, the short-term upside targets remain $5220, followed by $5230, and then $5260. If bullish momentum continues to build, the market could eventually push toward levels above $5300 in the next expansion phase.
As always, this chart will continue to be updated step by step as price reacts to the next important levels.
Please support me with your likes and comments to motivate me to share more analysis with you and share your opinion about the possible trend of this chart with me !
Best Regards , Arman Shaban
トレード稼働中
By analyzing the #Gold chart on the 1-hour timeframe, we can see that price once again reacted exactly as expected based on the previous analysis. Following the bullish continuation scenario, Gold successfully reached the $5220 and $5230 targets, and even extended the move further toward the $5240 level, delivering more than 300 pips of return from the discussed structure.After completing these targets, the market entered a corrective phase and Gold is currently trading around the $5190 demand zone as buyers and sellers battle for short-term control. At this stage, the $5185 level remains the key support for maintaining the bullish structure. If price manages to hold and stabilize above the $5185 level, we may expect another bullish expansion from this demand region. In that case, the next short-term upside targets to monitor are $5210, followed by $5225, then $5245, and potentially $5260 if bullish momentum continues to build.
トレード終了: 利益確定目標に到達
By analyzing the #Gold chart on the 1-hour timeframe, we can see that after the previous move where price reached the $5220 and $5230 targets and extended toward $5240, the market entered a corrective phase.During this pullback, Gold dropped toward the $5125 level, where buying pressure stepped in once again and prevented further downside.
Following this reaction from demand, price has started to recover and Gold is currently trading around the $5180 region, showing early signs of renewed bullish momentum.
At this stage, the $5185 level remains the key structural support for maintaining the bullish structure discussed in the previous analysis.
If price manages to hold above this region and stabilize, we may expect another bullish expansion from this demand zone.
In that case, the next short-term upside targets to monitor are $5200, followed by $5220, then $5240, and potentially $5265 if bullish momentum continues to build.

📘 Wanna Learn ICT & SMC? Get the Full Book Here : bit.ly/ICT-BOOK
⚜️ Free Telegram Channel : telegram.me/PriceAction_ICT
⚜️ JOIN THE VIP 👉 t.me/ArmanShabanTrading
🚀 MondFX — our trusted Broker : bit.ly/MondFx
⚜️ Free Telegram Channel : telegram.me/PriceAction_ICT
⚜️ JOIN THE VIP 👉 t.me/ArmanShabanTrading
🚀 MondFX — our trusted Broker : bit.ly/MondFx
関連の投稿
免責事項
これらの情報および投稿は、TradingViewが提供または承認する金融、投資、取引、またはその他の種類の助言もしくは推奨であることを意図したものではなく、またこれらに該当するものでもありません。詳細は利用規約をご覧ください。
📘 Wanna Learn ICT & SMC? Get the Full Book Here : bit.ly/ICT-BOOK
⚜️ Free Telegram Channel : telegram.me/PriceAction_ICT
⚜️ JOIN THE VIP 👉 t.me/ArmanShabanTrading
🚀 MondFX — our trusted Broker : bit.ly/MondFx
⚜️ Free Telegram Channel : telegram.me/PriceAction_ICT
⚜️ JOIN THE VIP 👉 t.me/ArmanShabanTrading
🚀 MondFX — our trusted Broker : bit.ly/MondFx
関連の投稿
免責事項
これらの情報および投稿は、TradingViewが提供または承認する金融、投資、取引、またはその他の種類の助言もしくは推奨であることを意図したものではなく、またこれらに該当するものでもありません。詳細は利用規約をご覧ください。