
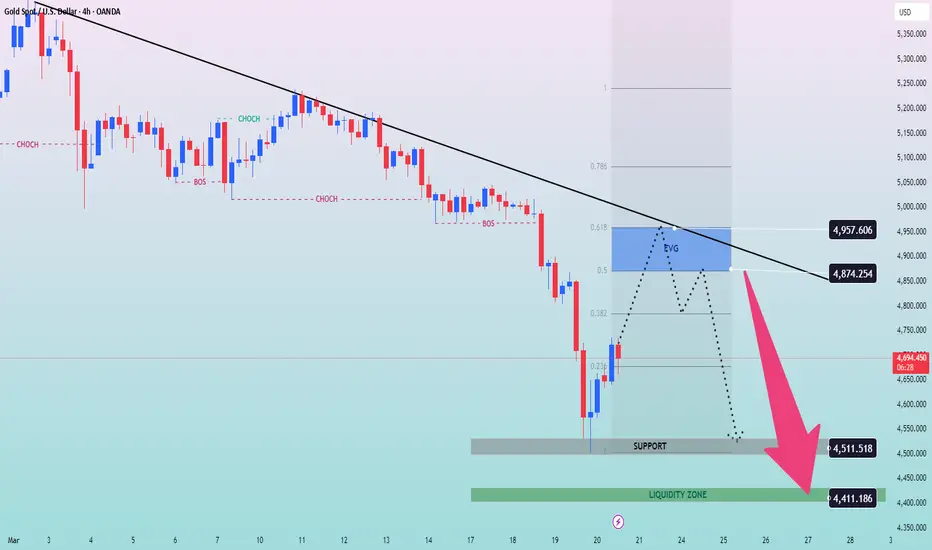
Gold is showing a short-term rebound on the H4 timeframe after an aggressive sell-off.
However, this bounce is happening right below a major descending trendline and inside a potential FVG zone, which raises concern.
Experienced traders know that not all rebounds signal reversals — many are simply liquidity setups before continuation.
Macro Narrative
• The Fed remains firm with its policy stance, keeping rates elevated.
• Stronger USD and bond yields continue to pressure gold.
• No major dovish catalyst has entered the market yet.
• Institutional flows still favor defensive positioning in USD over gold.
News Context
Recent market conditions reflect a continuation of post-Fed positioning, with no major shift in monetary expectations.
Without a clear macro catalyst, price action is being driven more by technical structure and liquidity flows.
IF–THEN News Scenarios
If USD strength persists:
Gold may fail at resistance and continue toward deeper liquidity near 4511 → 4411.
If sentiment shifts (risk-off or dovish tone):
Gold could extend the rebound toward higher resistance levels.
Technical Overview
On the H4 chart, gold remains in a clear bearish structure, respecting a long-term descending trendline.
The current bounce is approaching a Fair Value Gap (FVG) and trendline confluence zone around 4874 – 4957, which may act as strong resistance.
From a professional trading perspective, this type of move often represents a pullback to rebalance inefficiencies before continuation.
If sellers step in at this zone, the next downside targets align with 4511 (support) and deeper liquidity near 4411, where resting orders are likely concentrated.
The structure does not yet show a confirmed reversal — only a potential continuation setup.
Key Levels
Resistance Zone: 4874 – 4957 (FVG + Trendline)
Current Price Area: ~4724
Support: 4511
Major Liquidity Zone: 4411
Market Debate
Is this rebound a smart money accumulation
or just a liquidity trap before the next drop?
However, this bounce is happening right below a major descending trendline and inside a potential FVG zone, which raises concern.
Experienced traders know that not all rebounds signal reversals — many are simply liquidity setups before continuation.
Macro Narrative
• The Fed remains firm with its policy stance, keeping rates elevated.
• Stronger USD and bond yields continue to pressure gold.
• No major dovish catalyst has entered the market yet.
• Institutional flows still favor defensive positioning in USD over gold.
News Context
Recent market conditions reflect a continuation of post-Fed positioning, with no major shift in monetary expectations.
Without a clear macro catalyst, price action is being driven more by technical structure and liquidity flows.
IF–THEN News Scenarios
If USD strength persists:
Gold may fail at resistance and continue toward deeper liquidity near 4511 → 4411.
If sentiment shifts (risk-off or dovish tone):
Gold could extend the rebound toward higher resistance levels.
Technical Overview
On the H4 chart, gold remains in a clear bearish structure, respecting a long-term descending trendline.
The current bounce is approaching a Fair Value Gap (FVG) and trendline confluence zone around 4874 – 4957, which may act as strong resistance.
From a professional trading perspective, this type of move often represents a pullback to rebalance inefficiencies before continuation.
If sellers step in at this zone, the next downside targets align with 4511 (support) and deeper liquidity near 4411, where resting orders are likely concentrated.
The structure does not yet show a confirmed reversal — only a potential continuation setup.
Key Levels
Resistance Zone: 4874 – 4957 (FVG + Trendline)
Current Price Area: ~4724
Support: 4511
Major Liquidity Zone: 4411
Market Debate
Is this rebound a smart money accumulation
or just a liquidity trap before the next drop?
手動でトレードを終了しました
Gold prices did not rebound but instead fell sharply. The weekly and monthly candlestick charts closed with full force, seemingly confirming a medium-term downtrend reversal. Stay tuned for the next plan at the BIO link!

免責事項
これらの情報および投稿は、TradingViewが提供または承認する金融、投資、取引、またはその他の種類の助言もしくは推奨であることを意図したものではなく、またこれらに該当するものでもありません。詳細は利用規約をご覧ください。
免責事項
これらの情報および投稿は、TradingViewが提供または承認する金融、投資、取引、またはその他の種類の助言もしくは推奨であることを意図したものではなく、またこれらに該当するものでもありません。詳細は利用規約をご覧ください。