After Looking At " Daily Chart Time Frames"
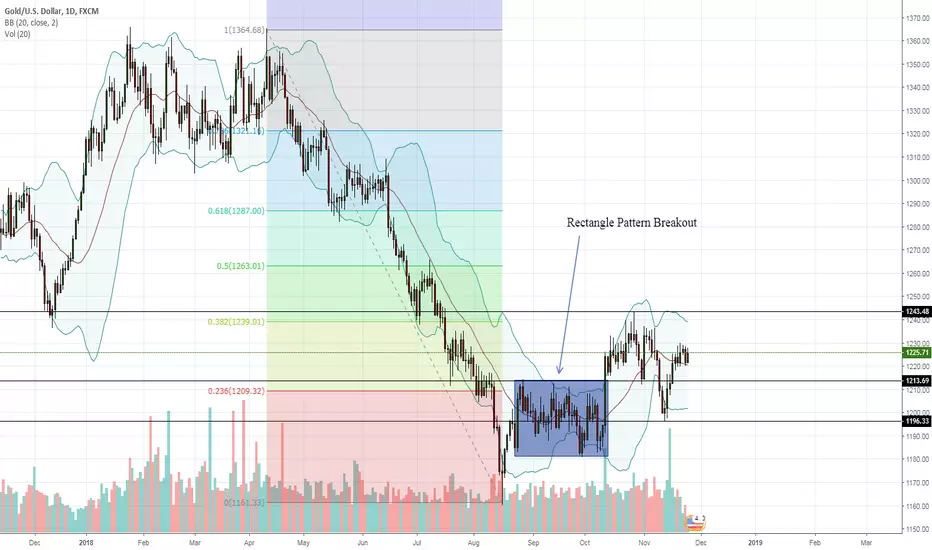
1.On 10th October 2018 There Was Rectangle Pattern Breakout .This Breakout is same on Weekly Chart 1214
That 1214 Is Strong Support Point For Gold
2.Recently on 13th Nov it traded one month low at 1196 So It Another Strongest Support
3.Looking at Fibonacci Level .38 any daily close above 1244 will be bullish Trend For Gold Till Target of 1280
 XAUUSDGOLD
On Fundamental Side : We are expecting High Unemployment rate for novemeber month in decemeber report and Higher number of non-farm payrolls Data
Secondly factor Which Can Lead Gold Upside Is Xi-Trump Meet
Third Is Brexit Event
Fourth is G20 Meeting Which Will Be another thing
For Investor and Traders who are looking to go long can go with stoploss of 1296 and target of 1264-1280
1.On 10th October 2018 There Was Rectangle Pattern Breakout .This Breakout is same on Weekly Chart 1214
That 1214 Is Strong Support Point For Gold
2.Recently on 13th Nov it traded one month low at 1196 So It Another Strongest Support
3.Looking at Fibonacci Level .38 any daily close above 1244 will be bullish Trend For Gold Till Target of 1280
XAUUSDGOLDOn Fundamental Side : We are expecting High Unemployment rate for novemeber month in decemeber report and Higher number of non-farm payrolls Data
Secondly factor Which Can Lead Gold Upside Is Xi-Trump Meet
Third Is Brexit Event
Fourth is G20 Meeting Which Will Be another thing
For Investor and Traders who are looking to go long can go with stoploss of 1296 and target of 1264-1280

免責事項
これらの情報および投稿は、TradingViewが提供または承認する金融、投資、取引、またはその他の種類の助言もしくは推奨であることを意図したものではなく、またこれらに該当するものでもありません。詳細は利用規約をご覧ください。
免責事項
これらの情報および投稿は、TradingViewが提供または承認する金融、投資、取引、またはその他の種類の助言もしくは推奨であることを意図したものではなく、またこれらに該当するものでもありません。詳細は利用規約をご覧ください。