
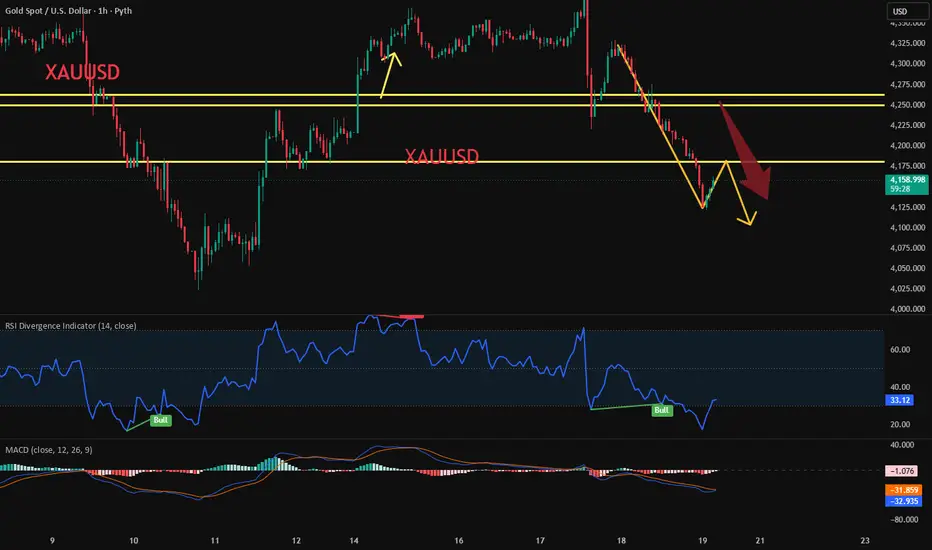
Following the surge in gold prices to levels exceeding 4370, a double-top pattern emerged, initiating a downward trend characterized by a classic bearish structure with progressively lower highs and a flattening rebound trajectory. Each corrective rally has been limited by prior resistance levels, indicating a gradual weakening of bullish momentum. The upper boundary of the trading range has been repeatedly validated, confirming a shift in the medium-term trend from bullish to bearish. 📉
The price zone between 4260 and 4270 represents a significant resistance area formed by the convergence of multiple moving averages. This level aligns with the 38.2% Fibonacci retracement and corresponds to a densely traded supply zone, creating a high-liquidity selling region. On the 4-hour chart, gold prices touched 4269 and subsequently formed consecutive shooting stars with extended upper shadows, confirming supply dominance in this area. 🕯 Furthermore, the 1-hour MACD indicator generated a bearish crossover following a top divergence, signaling continued downward momentum. Any short-term recovery appears to be a technical mean reversion rather than a reversal of the downside risk indicated by the volatility surface skew. 📊
Regarding trading strategy, it is recommended to initiate short positions around the 4180 level. 📉
The price zone between 4260 and 4270 represents a significant resistance area formed by the convergence of multiple moving averages. This level aligns with the 38.2% Fibonacci retracement and corresponds to a densely traded supply zone, creating a high-liquidity selling region. On the 4-hour chart, gold prices touched 4269 and subsequently formed consecutive shooting stars with extended upper shadows, confirming supply dominance in this area. 🕯 Furthermore, the 1-hour MACD indicator generated a bearish crossover following a top divergence, signaling continued downward momentum. Any short-term recovery appears to be a technical mean reversion rather than a reversal of the downside risk indicated by the volatility surface skew. 📊
Regarding trading strategy, it is recommended to initiate short positions around the 4180 level. 📉
トレード稼働中
Short position yielding perfect profits.
免責事項
これらの情報および投稿は、TradingViewが提供または承認する金融、投資、取引、またはその他の種類の助言もしくは推奨であることを意図したものではなく、またこれらに該当するものでもありません。詳細は利用規約をご覧ください。
免責事項
これらの情報および投稿は、TradingViewが提供または承認する金融、投資、取引、またはその他の種類の助言もしくは推奨であることを意図したものではなく、またこれらに該当するものでもありません。詳細は利用規約をご覧ください。