
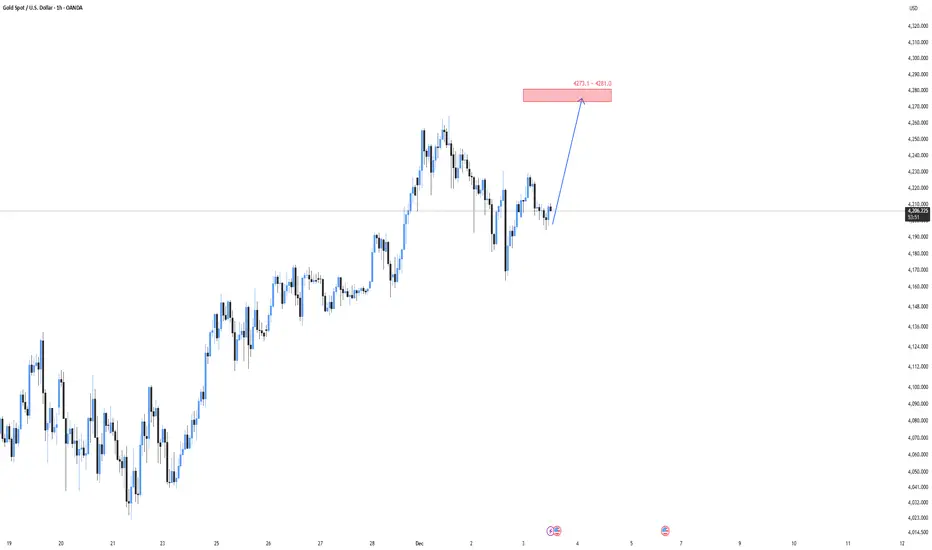
Gold continues to show intraday strength after holding above recent higher-low structure.
The current bullish leg appears corrective in nature, with price aiming toward the
4273–4281 supply zone highlighted on the chart.
From a fundamental perspective, demand for gold remains supported as markets weigh
the possibility of softer U.S. economic data and expectations of future Fed easing in 2026.
Risk-off flows have also kept buyers active on dips. As long as price holds its internal
bullish structure, a push into the overhead imbalance remains likely.
I’ll be watching how price reacts once it reaches the 4273–4281 zone — this area could
offer a reaction or potential short-term reversal depending on order flow.
The current bullish leg appears corrective in nature, with price aiming toward the
4273–4281 supply zone highlighted on the chart.
From a fundamental perspective, demand for gold remains supported as markets weigh
the possibility of softer U.S. economic data and expectations of future Fed easing in 2026.
Risk-off flows have also kept buyers active on dips. As long as price holds its internal
bullish structure, a push into the overhead imbalance remains likely.
I’ll be watching how price reacts once it reaches the 4273–4281 zone — this area could
offer a reaction or potential short-term reversal depending on order flow.

For live market updates and high-probability setups, join my Telegram: t.me/G_Traders
関連の投稿
免責事項
これらの情報および投稿は、TradingViewが提供または承認する金融、投資、取引、またはその他の種類の助言もしくは推奨であることを意図したものではなく、またこれらに該当するものでもありません。詳細は利用規約をご覧ください。
For live market updates and high-probability setups, join my Telegram: t.me/G_Traders
関連の投稿
免責事項
これらの情報および投稿は、TradingViewが提供または承認する金融、投資、取引、またはその他の種類の助言もしくは推奨であることを意図したものではなく、またこれらに該当するものでもありません。詳細は利用規約をご覧ください。