Gold ( XAUUSD) Daily: Dynamic Support Reclaim Sets Up Pivotal Test Against Confluent LTB & 4,442 Resistance Barrier
### 🟨 Gold Spot / U.S. Dollar (XAUUSD) Daily Technical Matrix (Ref: XAUUSD_2026-08-17_08-58-39.png)
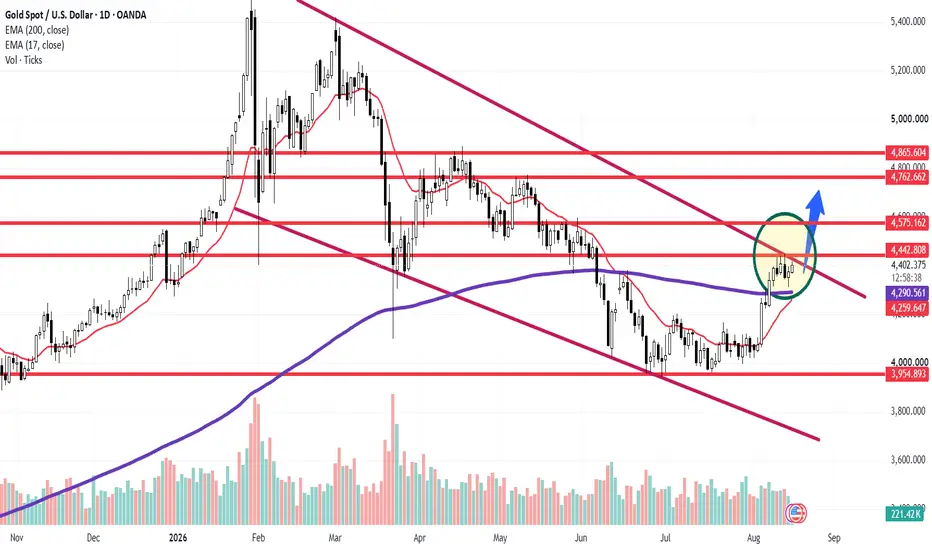
We are releasing an updated Daily (1D) structural study on Gold (XAUUSD). Following a successful defense and reclaim of its institutional moving average baseline, price action has built a tight accumulation structure (highlighted zone) above dynamic support, positioning for a high-confluence breakout test.
Gold is currently trading up **+0.65% (+28.240 pts)** at **4,405.060**, holding firmly above its short-term and multi-month moving averages.
---
### 🔍 Technical Architecture & Multi-Layered Resistance Roadmap:
Our quantitative matrix isolates key technical hurdles and expansion targets along the active bullish recovery vector (blue arrow):
1. **Institutional Base Defense & Moving Average Reclaim:** Price action has established a solid demand floor above the **200-period EMA (purple line at 4,290.587)** and the **17-period EMA (red line at 4,259.945)**, confirming buy-side absorption during the latest pullback.
2. **Immediate Confluence Ceiling (Key Breakout Node):**
* **Primary Barrier:** **4,442.808** — Static horizontal resistance aligned directly with the primary macro descending trendline (maroon LTB). Clearing this key inflection point is mandatory to confirm macro bullish continuation.
3. **Sequential Overhead Resistance Targets:**
* **Target Node 1:** **4,575.162** — Intermediate horizontal supply zone.
* **Target Node 2:** **4,762.662** — High-volume structural ceiling.
* **Target Node 3:** **4,865.604** — Major macro peak resistance.
---
### 🛡️ Strategic Operational Scenarios:
* **Scenario A — Confluent LTB Breakout & Expansion (Blue Arrow):** A decisive daily candle close above **4,442.808** and the maroon LTB trendline confirms structural breakout momentum, opening a direct pathway toward **4,575.162** and **4,762.662**.
* **Scenario B — Pullback Consolidation Above Dynamic Floor:** Failure to clear **4,442.808** on the initial test will likely trigger a minor consolidation back toward the **200-EMA (4,290.587)** and **17-EMA (4,259.945)** support cluster to accumulate fresh buying volume before another attempt.
### 📊 Tactical Parameters Summary:
* **Current Bias:** Neutral-Bullish Accumulation / Pending Resistance Test
* **Immediate Confluent Resistance Ceiling (LTB):** 4,442.808
* **Secondary Overhead Target Nodes:** 4,575.162 / 4,762.662 / 4,865.604
* **Institutional Anchor Support (200-EMA):** 4,290.587
* **Dynamic Short-Term Support (17-EMA):** 4,259.945
* **Macro Structural Base Floor:** 3,954.893
---
📊 **ChartPro Data**
*Precious Metals Architecture, Dynamic EMA Confluences & Systematic Risk Management.*
⚠️ **Disclaimer:** For educational and informational purposes only. This active market study represents a personal trading framework and does not constitute financial or investment advice.
XAUUSD) Daily: Dynamic Support Reclaim Sets Up Pivotal Test Against Confluent LTB & 4,442 Resistance Barrier### 🟨 Gold Spot / U.S. Dollar (
XAUUSD) Daily Technical Matrix (Ref: XAUUSD_2026-08-17_08-58-39.png)We are releasing an updated Daily (1D) structural study on Gold (
XAUUSD). Following a successful defense and reclaim of its institutional moving average baseline, price action has built a tight accumulation structure (highlighted zone) above dynamic support, positioning for a high-confluence breakout test.Gold is currently trading up **+0.65% (+28.240 pts)** at **4,405.060**, holding firmly above its short-term and multi-month moving averages.
---
### 🔍 Technical Architecture & Multi-Layered Resistance Roadmap:
Our quantitative matrix isolates key technical hurdles and expansion targets along the active bullish recovery vector (blue arrow):
1. **Institutional Base Defense & Moving Average Reclaim:** Price action has established a solid demand floor above the **200-period EMA (purple line at 4,290.587)** and the **17-period EMA (red line at 4,259.945)**, confirming buy-side absorption during the latest pullback.
2. **Immediate Confluence Ceiling (Key Breakout Node):**
* **Primary Barrier:** **4,442.808** — Static horizontal resistance aligned directly with the primary macro descending trendline (maroon LTB). Clearing this key inflection point is mandatory to confirm macro bullish continuation.
3. **Sequential Overhead Resistance Targets:**
* **Target Node 1:** **4,575.162** — Intermediate horizontal supply zone.
* **Target Node 2:** **4,762.662** — High-volume structural ceiling.
* **Target Node 3:** **4,865.604** — Major macro peak resistance.
---
### 🛡️ Strategic Operational Scenarios:
* **Scenario A — Confluent LTB Breakout & Expansion (Blue Arrow):** A decisive daily candle close above **4,442.808** and the maroon LTB trendline confirms structural breakout momentum, opening a direct pathway toward **4,575.162** and **4,762.662**.
* **Scenario B — Pullback Consolidation Above Dynamic Floor:** Failure to clear **4,442.808** on the initial test will likely trigger a minor consolidation back toward the **200-EMA (4,290.587)** and **17-EMA (4,259.945)** support cluster to accumulate fresh buying volume before another attempt.
### 📊 Tactical Parameters Summary:
* **Current Bias:** Neutral-Bullish Accumulation / Pending Resistance Test
* **Immediate Confluent Resistance Ceiling (LTB):** 4,442.808
* **Secondary Overhead Target Nodes:** 4,575.162 / 4,762.662 / 4,865.604
* **Institutional Anchor Support (200-EMA):** 4,290.587
* **Dynamic Short-Term Support (17-EMA):** 4,259.945
* **Macro Structural Base Floor:** 3,954.893
---
📊 **ChartPro Data**
*Precious Metals Architecture, Dynamic EMA Confluences & Systematic Risk Management.*
⚠️ **Disclaimer:** For educational and informational purposes only. This active market study represents a personal trading framework and does not constitute financial or investment advice.

免責事項
これらの情報および投稿は、TradingViewが提供または承認する金融、投資、取引、またはその他の種類の助言もしくは推奨であることを意図したものではなく、またこれらに該当するものでもありません。詳細は利用規約をご覧ください。
免責事項
これらの情報および投稿は、TradingViewが提供または承認する金融、投資、取引、またはその他の種類の助言もしくは推奨であることを意図したものではなく、またこれらに該当するものでもありません。詳細は利用規約をご覧ください。