
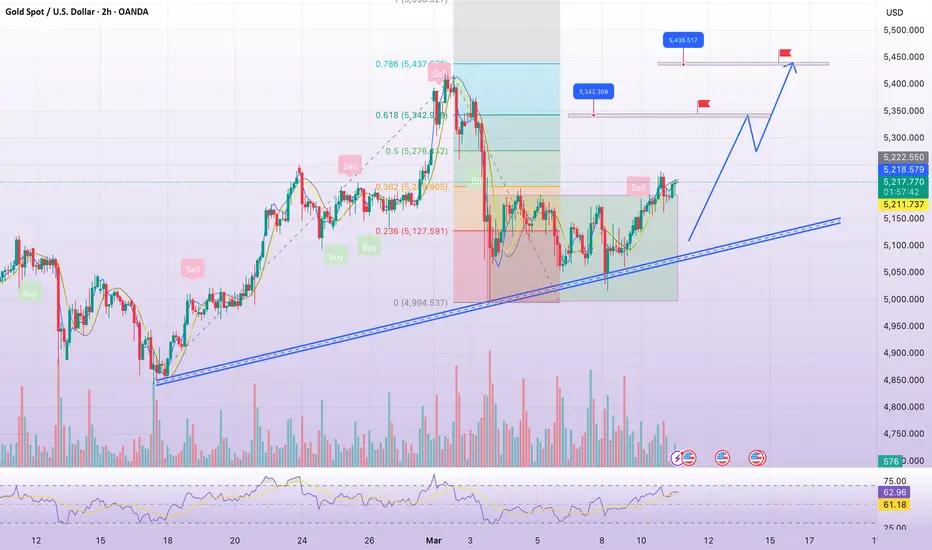
🔺Related Information: (XAU/USD)
Markets remain focused on geopolitical developments in the Middle East, where escalating rhetoric between Iran and the US continues to raise risks to global oil supply. Iran’s Islamic Revolutionary Guard Corps warned that continued US and Israeli strikes could lead to disruptions in regional oil exports, while Donald Trump cautioned that any attempt to block the Strait of Hormuz would trigger a US response. Prolonged tensions could sustain safe-haven demand for Gold.
Attention now turns to Wednesday’s US Consumer Price Index (CPI) report, with headline inflation expected at 2.4% YoY and core CPI at 2.5%. A stronger-than-expected reading could support the US Dollar and weigh on USD-denominated commodities in the near term.
🔜🔜🔜🔜🔜🔜🔜🔜🔜🔜
📌 Chart analysis:
🔗 Short-term timeframes: M15, M45, H1
Short-term timeframe, H1 officially confirms breakout from sideways price range: resistance at 5205.
Moving along the EMA lines, short timeframe
overwhelming buying volume
🔗 Medium-term timeframes: H2, H4
Breaking above 5200, closing above EMA, short-term and long-term consensus is bullish.
Key zones:
🔗 Supply zone (resistance): 5.262, 5.342
🔗 Demand zone (support): 5.155 , 5.125, 5.095
🔗 Three EMA moving averages; technical indicators: stochastic, volume
set up signal : 🔗 BUY XAU 5154 - 5157 stoploss: 5149
Take profit : 5176 - 5200 - 5234
🔜🔜🔜🔜🔜🔜🔜🔜🔜🔜
✏️ Personal opinion:
If the price breaks through and sustains the upward trend, buying pressure will remain strong above 5200-5300.
📥 Follow us for the most accurate gold price trends.
Markets remain focused on geopolitical developments in the Middle East, where escalating rhetoric between Iran and the US continues to raise risks to global oil supply. Iran’s Islamic Revolutionary Guard Corps warned that continued US and Israeli strikes could lead to disruptions in regional oil exports, while Donald Trump cautioned that any attempt to block the Strait of Hormuz would trigger a US response. Prolonged tensions could sustain safe-haven demand for Gold.
Attention now turns to Wednesday’s US Consumer Price Index (CPI) report, with headline inflation expected at 2.4% YoY and core CPI at 2.5%. A stronger-than-expected reading could support the US Dollar and weigh on USD-denominated commodities in the near term.
🔜🔜🔜🔜🔜🔜🔜🔜🔜🔜
📌 Chart analysis:
🔗 Short-term timeframes: M15, M45, H1
Short-term timeframe, H1 officially confirms breakout from sideways price range: resistance at 5205.
Moving along the EMA lines, short timeframe
overwhelming buying volume
🔗 Medium-term timeframes: H2, H4
Breaking above 5200, closing above EMA, short-term and long-term consensus is bullish.
Key zones:
🔗 Supply zone (resistance): 5.262, 5.342
🔗 Demand zone (support): 5.155 , 5.125, 5.095
🔗 Three EMA moving averages; technical indicators: stochastic, volume
set up signal : 🔗 BUY XAU 5154 - 5157 stoploss: 5149
Take profit : 5176 - 5200 - 5234
🔜🔜🔜🔜🔜🔜🔜🔜🔜🔜
✏️ Personal opinion:
If the price breaks through and sustains the upward trend, buying pressure will remain strong above 5200-5300.
📥 Follow us for the most accurate gold price trends.
トレード稼働中
CPI data came in as expected, and gold dropped back to 5170.
関連の投稿
免責事項
これらの情報および投稿は、TradingViewが提供または承認する金融、投資、取引、またはその他の種類の助言もしくは推奨であることを意図したものではなく、またこれらに該当するものでもありません。詳細は利用規約をご覧ください。
関連の投稿
免責事項
これらの情報および投稿は、TradingViewが提供または承認する金融、投資、取引、またはその他の種類の助言もしくは推奨であることを意図したものではなく、またこれらに該当するものでもありません。詳細は利用規約をご覧ください。