
Day 20 of 90 — Liquidity Sweeps and Market Reactions
XAUUSD | M15 | Sentinel Lite
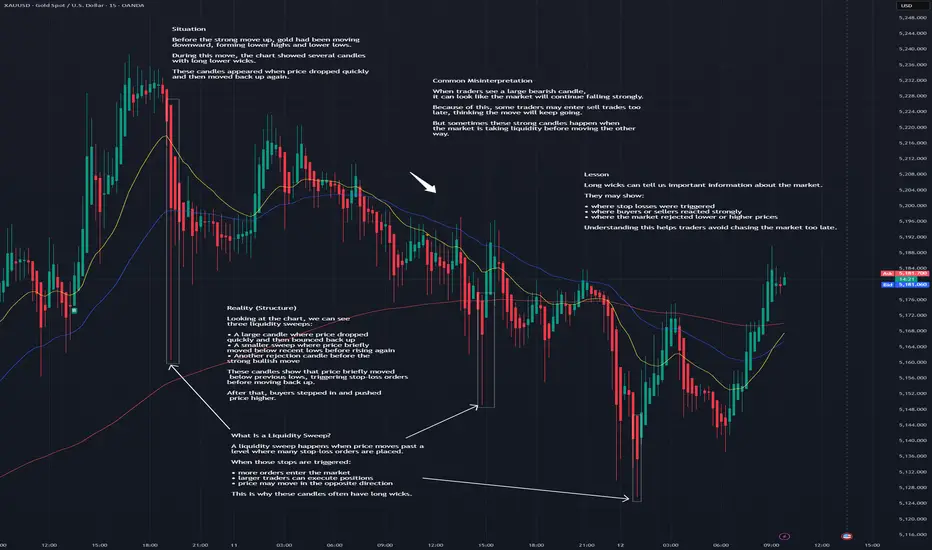
Situation
Before the strong move up, gold had been moving downward, forming lower highs and lower lows.
During this move, the chart showed several candles with long lower wicks.
These candles appeared when price dropped quickly and then moved back up again.
Common Misinterpretation
When traders see a large bearish candle, it can look like the market will continue falling strongly.
Because of this, some traders may enter sell trades too late, thinking the move will keep going.
But sometimes these strong candles happen when the market is taking liquidity before moving the other way.
Reality (Structure)
Looking at the chart, we can see three liquidity sweeps:
• A large candle where price dropped quickly and then bounced back up
• A smaller sweep where price briefly moved below recent lows before rising again
• Another rejection candle before the strong bullish move
These candles show that price briefly moved below previous lows, triggering stop-loss orders.
After that, buyers stepped in and pushed price higher.
What Is a Liquidity Sweep?
A liquidity sweep happens when price moves past a level where many stop-loss orders are placed.
When those stops are triggered:
• more orders enter the market
• larger traders can execute positions
• price may move in the opposite direction
This is why these candles often have long wicks.
Lesson
Long wicks can tell us important information about the market.
They may show:
• where stop losses were triggered
• where buyers or sellers reacted strongly
• where the market rejected lower or higher prices
Understanding this helps traders avoid chasing the market too late.
Sentinel Principle
You do not trade every pattern.
You trade aligned conditions.
🛡 Discipline > Impulse
#XAUUSD
#Gold
#PriceAction
#MarketStructure
#LiquiditySweep
#TradingEducation
#TradingForBeginners
#TechnicalAnalysis
#SentinelLite
#TradingJourney
#IntradayTrading
XAUUSD | M15 | Sentinel Lite
Situation
Before the strong move up, gold had been moving downward, forming lower highs and lower lows.
During this move, the chart showed several candles with long lower wicks.
These candles appeared when price dropped quickly and then moved back up again.
Common Misinterpretation
When traders see a large bearish candle, it can look like the market will continue falling strongly.
Because of this, some traders may enter sell trades too late, thinking the move will keep going.
But sometimes these strong candles happen when the market is taking liquidity before moving the other way.
Reality (Structure)
Looking at the chart, we can see three liquidity sweeps:
• A large candle where price dropped quickly and then bounced back up
• A smaller sweep where price briefly moved below recent lows before rising again
• Another rejection candle before the strong bullish move
These candles show that price briefly moved below previous lows, triggering stop-loss orders.
After that, buyers stepped in and pushed price higher.
What Is a Liquidity Sweep?
A liquidity sweep happens when price moves past a level where many stop-loss orders are placed.
When those stops are triggered:
• more orders enter the market
• larger traders can execute positions
• price may move in the opposite direction
This is why these candles often have long wicks.
Lesson
Long wicks can tell us important information about the market.
They may show:
• where stop losses were triggered
• where buyers or sellers reacted strongly
• where the market rejected lower or higher prices
Understanding this helps traders avoid chasing the market too late.
Sentinel Principle
You do not trade every pattern.
You trade aligned conditions.
🛡 Discipline > Impulse
#XAUUSD
#Gold
#PriceAction
#MarketStructure
#LiquiditySweep
#TradingEducation
#TradingForBeginners
#TechnicalAnalysis
#SentinelLite
#TradingJourney
#IntradayTrading

— Pips0mnian | Precision over prediction
関連の投稿
免責事項
これらの情報および投稿は、TradingViewが提供または承認する金融、投資、取引、またはその他の種類の助言もしくは推奨であることを意図したものではなく、またこれらに該当するものでもありません。詳細は利用規約をご覧ください。
— Pips0mnian | Precision over prediction
関連の投稿
免責事項
これらの情報および投稿は、TradingViewが提供または承認する金融、投資、取引、またはその他の種類の助言もしくは推奨であることを意図したものではなく、またこれらに該当するものでもありません。詳細は利用規約をご覧ください。